
Use these demo reports as your personal sandbox. You can explore, modify, save, and share them without logging in.
|
Preview |
Demo report |
|---|---|
|
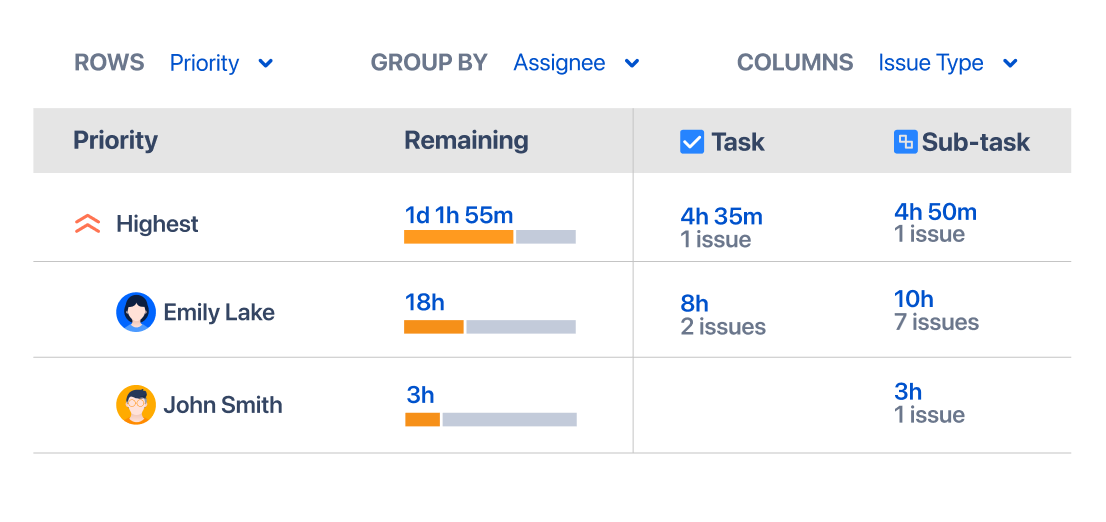
The Demo project report shows how you can easily represent data from work items as a pivot table with no hassle. |
|
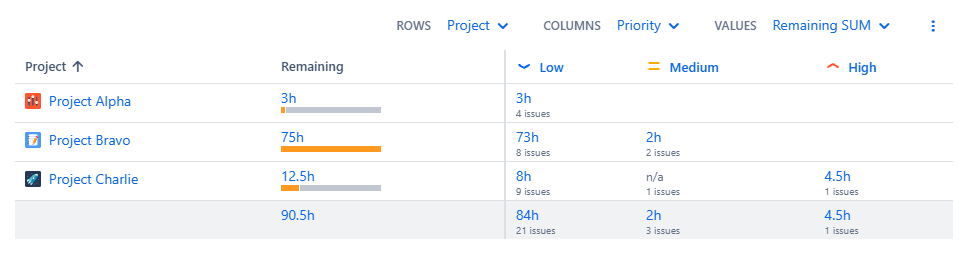
The Cross Projects report demonstrates how work items can be sourced from multiple spaces and grouped visually across each report tab. |
-20260630-201757.png?cb=9b9c40e1d056018d4276855329badead)
|
The Custom pivot tabs report shows how you can customize Pivot tabs to analyze the same data in different ways. Learn more about Pivot tab types in a related article. |
|
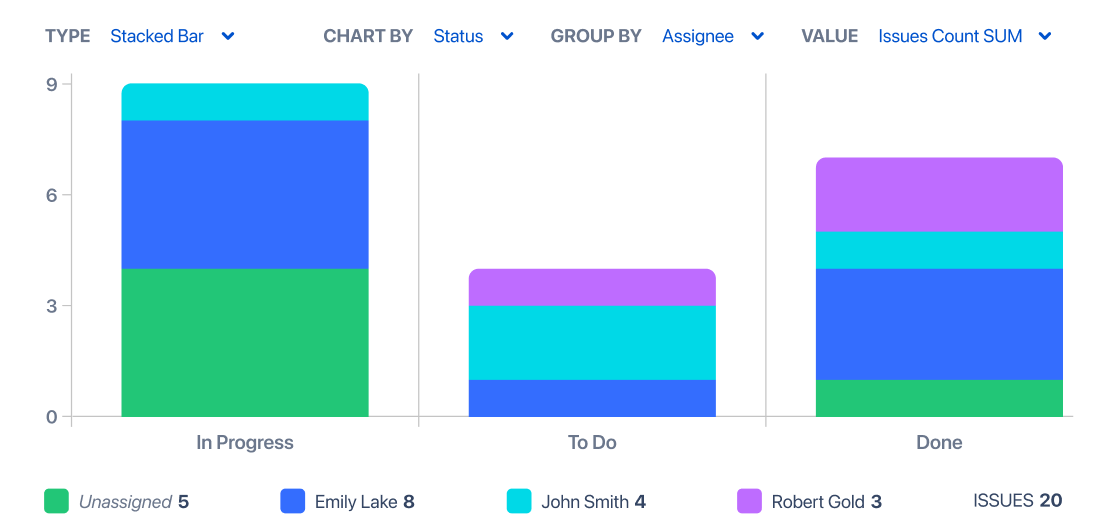
The Charts report lets you visualize your data using a variety of chart types. Learn more about the Charts tab type in a related article. |
|
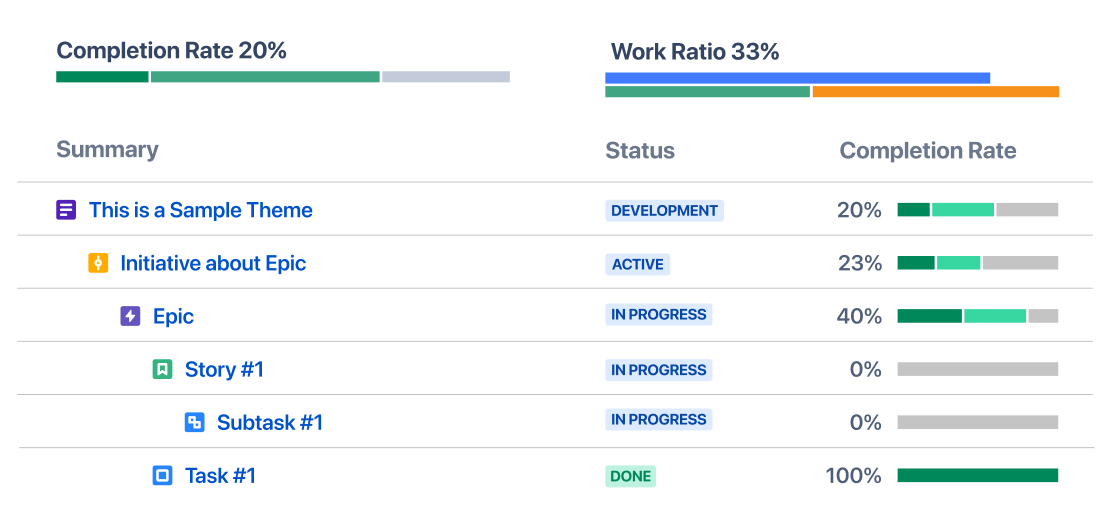
The Custom Hierarchy report demonstrates how to use a custom hierarchy (for example, Theme → Initiative → Epic), independently of the hierarchy configured in your Jira environment. Learn more about custom hierarchies in a related article. |
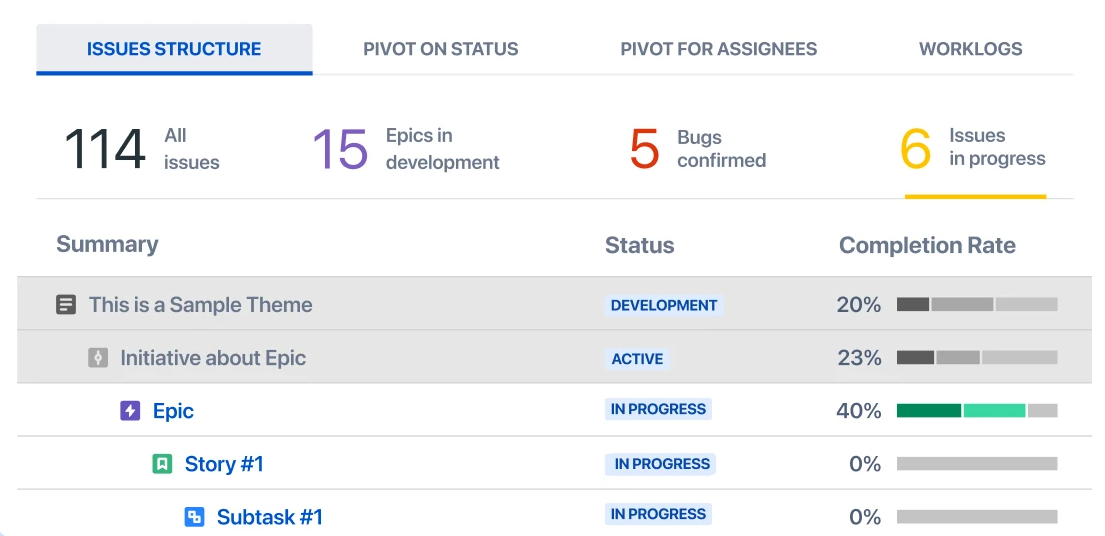
|
The Custom Slices report shows how customized slices can display remaining time instead of work item counts by using custom JQL for each slice. Learn more about Slices in a related article. |
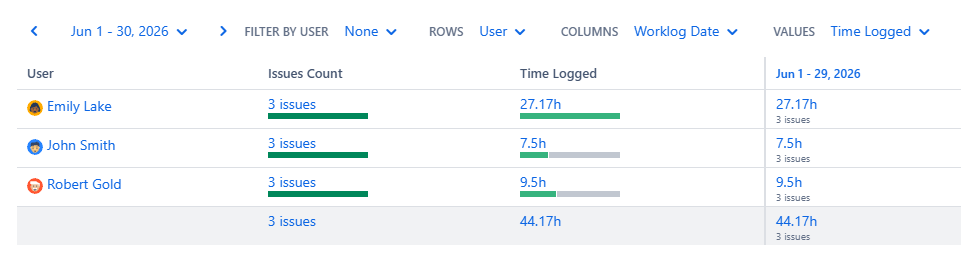
|
The Worklogs report demonstrates how you can analyze logged time and comments. Learn more about the Worklogs tab type in a related article. |
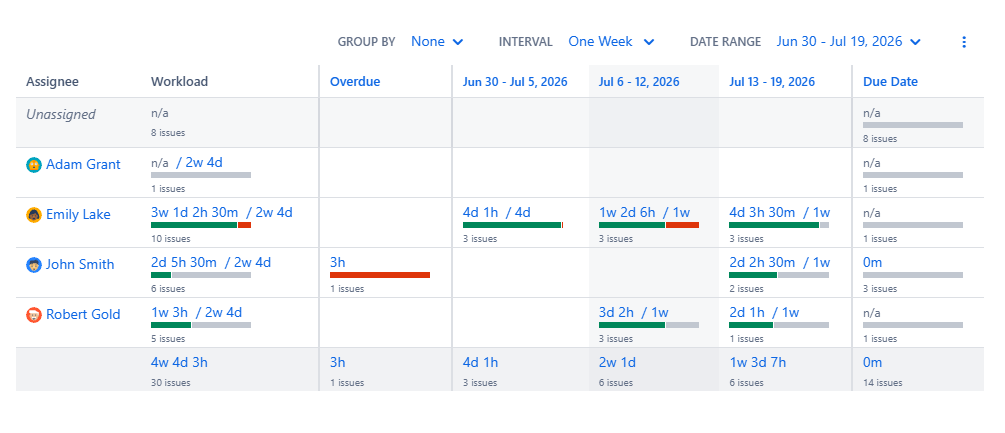
|
The Workload Capacity report helps you visualize whether your team's workload is manageable and whether due dates are likely to be met. Learn more about the Workload Capacity tab type in a related article. |
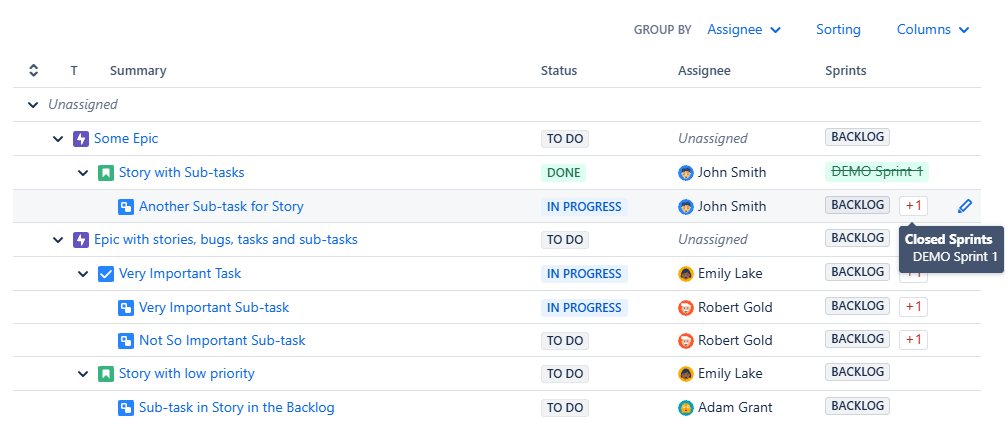
|
The Backlog report lets you preview the backlog from an existing board. Learn more about creating sprint-based reports in a related article. |
|
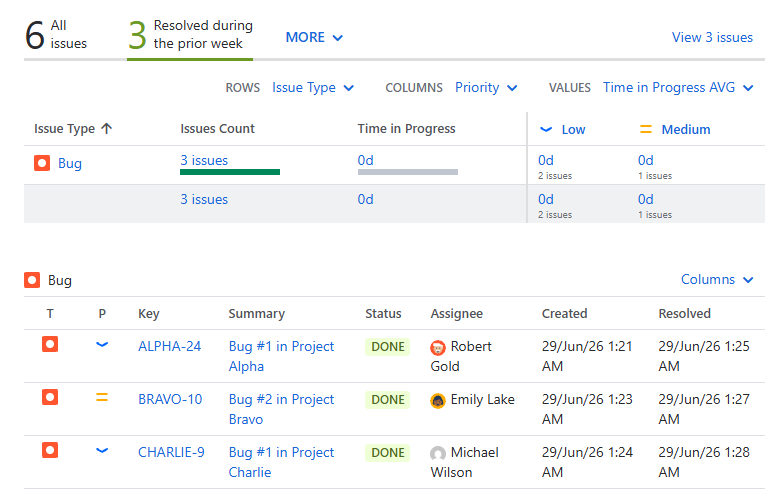
The Throughput report shows how JQL can be used in slices to filter issues by when they were created or resolved. For example, you can compare issues created and resolved weekly or quarterly, as well as issues that remain in progress for more than four weeks or were created during the same period. Learn more about using JQL to filter issues linked to Zendesk tickets or any other issues in a related article. |
|
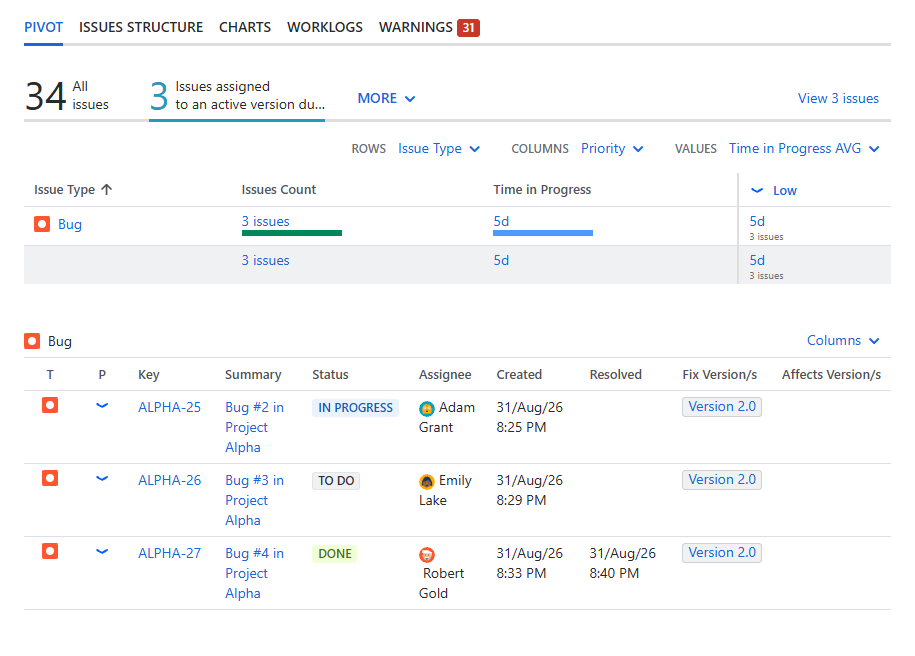
The Scope change report shows how JQL can be used in slices to filter issues by when they added or removed from an active fix version. Learn more about using JQL to filter issues such as scope and non-scope changes in a related article. |
FAQ
Can you save a report created in the demo site?
Yes. You can save a report that you create or modify in the demo site and share it with others by using its URL.
To save and share a report:
-
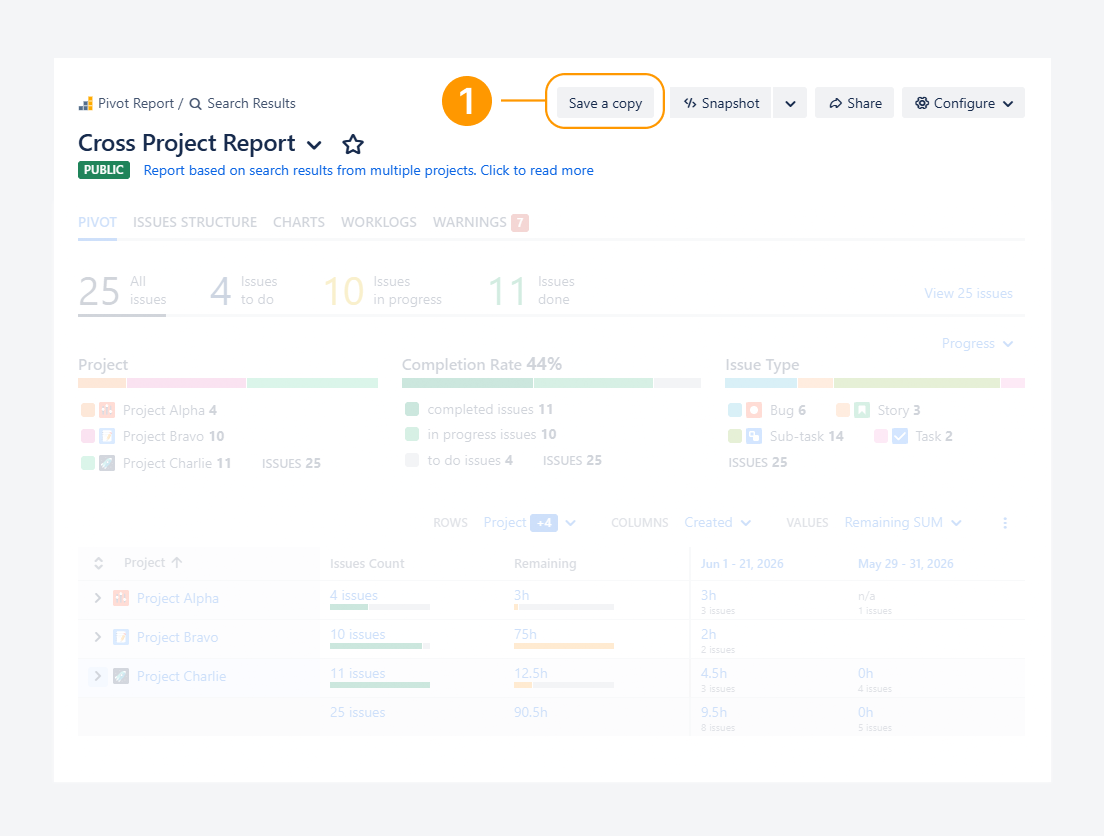
Click Save a copy to create a copy of one of the standard demo reports described in this article.
-
If you make any changes to the report, click Save.
-
Click Share to copy or share the report's URL.
-20260630-200247.png?cb=e09a034780a92b5279b563574be6d9cb)
If you have questions or need assistance, contact our support team via email or service desk. Our team is available Monday through Friday (9:00 AM to 7:00 PM GMT+7) to help with technical challenges or discuss improvements.