
-20260513-020918.png?cb=7f9660926e1d7d46e9341cc0e65b6444)
This article explains how and why to use Time in Status within the slices, progress, summary, and breakdown sections, within the Work item Structure, Worklogs/Comments, and Warnings tab types.
To test which Time in Status indicators best fit your spaces, try this demo.
Why should you use it?
Time in Status helps you measure how long work items, such as feature requests, incidents, and bugs, remain in the backlog before work starts, and how long they stay in progress afterward.
For example, a low-priority bug may spend one month in the backlog and one day in progress. If a higher-priority bug remains in progress for the same amount of time or longer, you can investigate whether work items are being planned and resolved according to their priority.
You can also compare Time in Status values with estimates to verify if an overrun is likely.
For example, if a bug is estimated to be resolved within one week but remains in progress for longer without worklogs being entered, you can identify a possible overrun before it becomes apparent through logged work.
Where can you use it?
Time in Status measurements are used across most report tab types:
-
They can appear as fields within columns in the Work item Structure and Worklogs/Comments tab types. They can also be used as values within the Pivot tab type.
-
In addition, Time in Status measurements can be displayed as indicators in the Progress section or used as slice values across all tab types.
How is Time in Status measured?
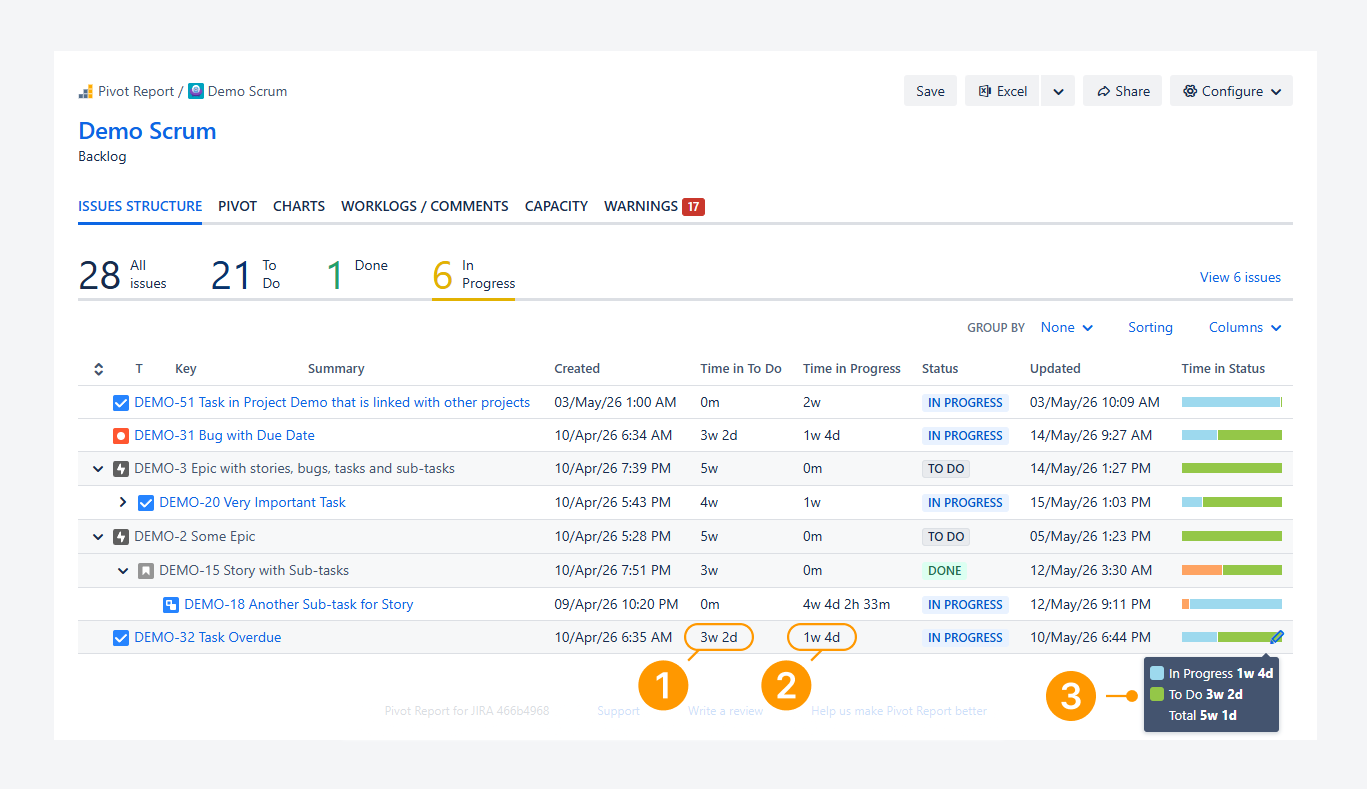
Time in Status can be measured in four ways.
-
Time in To Do: This measurement shows how long a work item remains in the To Do status category, starting from the Created date until the current date and time. The value stops increasing when the work item moves to either In Progress or Done.
In the example above, the work item spent more than three weeks in the To Do status category.
-
Time in Progress: This measurement shows how long a work item remains in the In Progress status category, starting from the moment it enters that category until the current date and time. The value stops increasing when the work item moves to Done.
In the example above, the work item has spent more than one week in the In Progress status category to date.
-
Time in Status: This measurement displays a horizontally stacked bar that shows how much time elapsed between each status transition. The total time appears in a tooltip when you hover over or click the bar.
In the example above, the right segment represents Time in To Do, while the left segment represents Time in Progress.
-
Time in Status Group (not shown): This measurement displays a horizontally stacked bar that shows how much time elapsed within each status category.
Note: You can enable the Status Category Changed column to show the date and time when a work item moves from one status category to another, such as from To Do to In Progress.
Features and use cases
Measure Time in Status for weekly bugs or incidents
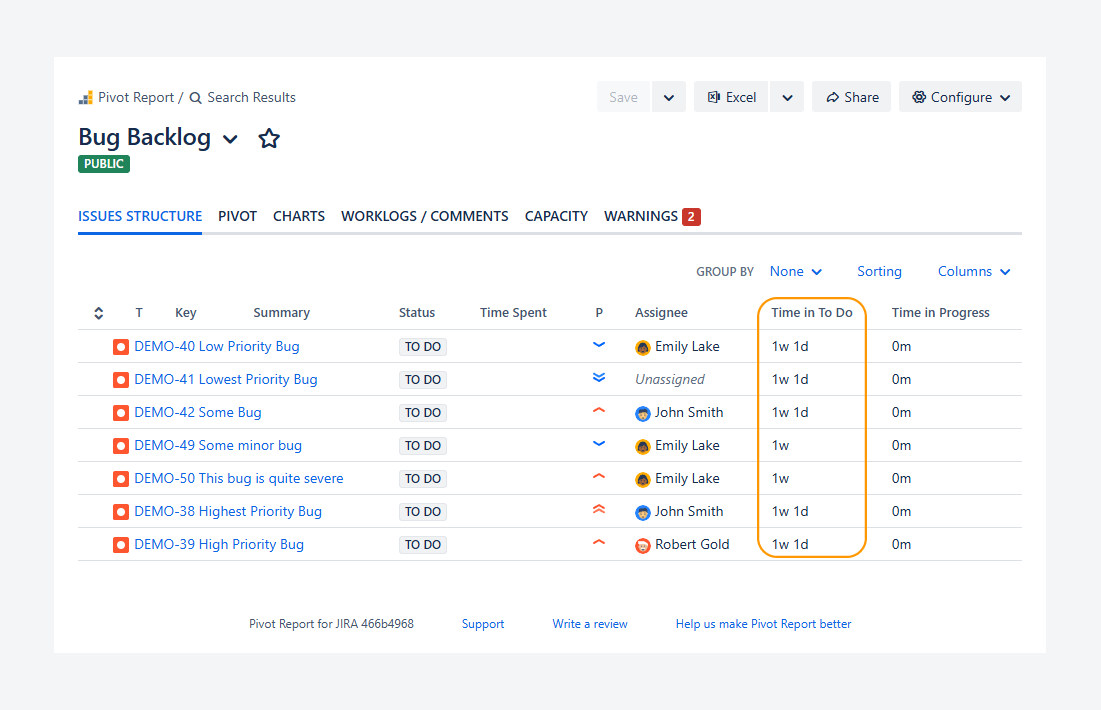
You can measure how long bugs or incidents remain in a given status to identify deviations from expected resolution times, especially when filtering by creation date.
For example, you can use this JQL query as a report source to filter work items created in the previous week: created >= startOfWeek("-1w") AND created < startOfWeek()
In the screenshot above, bugs created during that period have not changed status since creation, and no time has been logged.
As a result, the expected one-week resolution time was not met, and some bugs have exceeded the target by one day.
Measure Time in Status Group when using more than 3 status options
Time in Status Group measurement is recommended when a space contains more than three statuses. If you use the Time in Status metric instead, every individual status appears in the stacked bar, which can make it difficult to identify the related status category.
By comparison, the Time in Status Group metric groups statuses by category, making the chart easier to interpret, as shown in the following example.
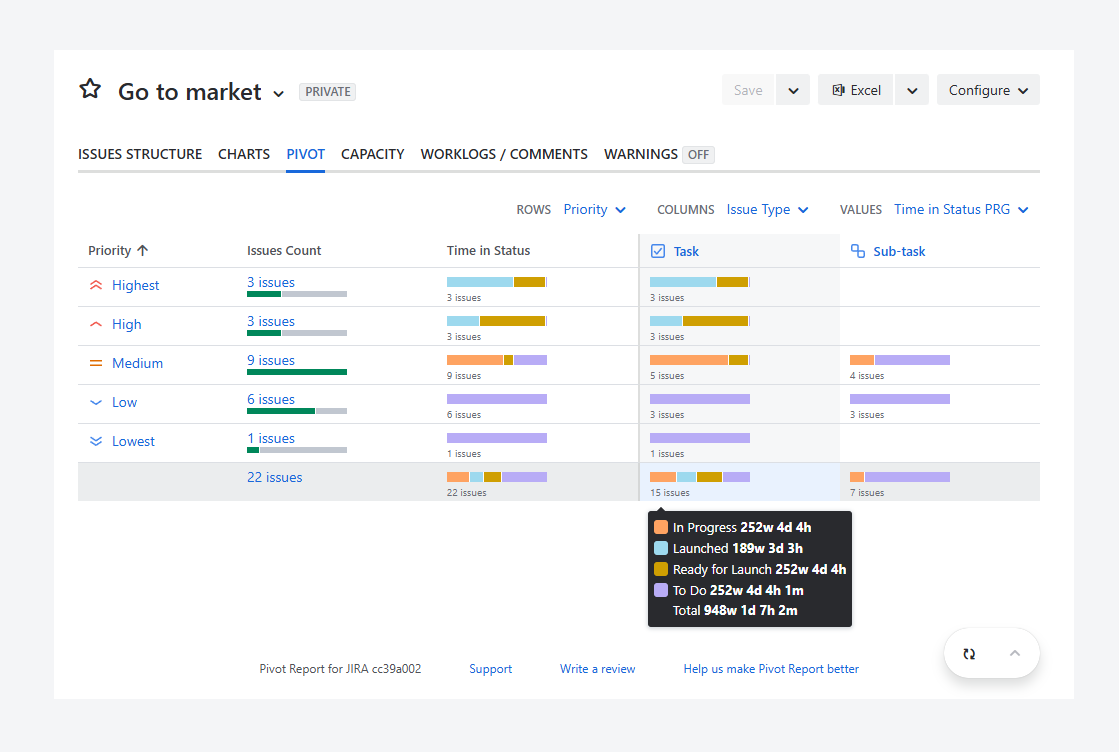
The screenshot above shows when Time in Status is used as a value within the Pivot Report tab type when a space contains more than three statuses.
Based on the tooltip shown, it may be unclear whether the Ready for Launch and Launched statuses represent work items that are still active or already delivered.
By switching the value from Time in Status to Time in Status Group, as shown in the screenshot below, you can view the status category associated with each status.
This makes it easier to distinguish completed work from active work and improves your ability to measure what is considered Done.
-20260528-024447.png?cb=d1b82babf586945475d86dc94cb8ce69)
Identify potential overruns while planning future sprints
-20260519-032947.png?cb=a137d0b421342ff05922332bf4b9973e)
You can measure how long work items remain in a status to help identify potential overruns while planning future sprints.
For example, in the screenshot above, the sub-task stayed in the In Progress status for more than four weeks after it was created, while only one week of work was logged during that time. This may suggest that some hours were not recorded over several weeks, which could indicate a possible overrun.
You can also enable the Time Budget column to assess whether an overrun is likely or has already occurred.
In the screenshot below, the sub-task is shown as 77% (177% shown), or three days over budget (3d 30m shown), based on the comparison between the original estimate, time spent, and remaining estimate.
-20260519-033956.png?cb=fb3463c0c7c784afde830949abb83d29)
FAQ
Can more status columns be shown?
No. Columns are limited to the To Do and In Progress status categories to show how long a work item stays in each status.
If this restriction did not exist, all statuses from your Jira instance would be displayed, including statuses from spaces that use different workflows. In that case, you could not distinguish between issues that use a particular status and work items from spaces where that status does not exist.
For example, a Waiting for Customer status may exist in a space used to track the development of custom features. However, the same status may not exist in an internal space used to track the development of features available across all products.
While there is no separate column for the Done status category, the time elapsed since an issue was resolved is included in the Time in Status group indicator.
-20260808-013349.png?cb=7df41479eb8eec74260aff5edb855bf7)
Can you change the appearance of Time in Status?
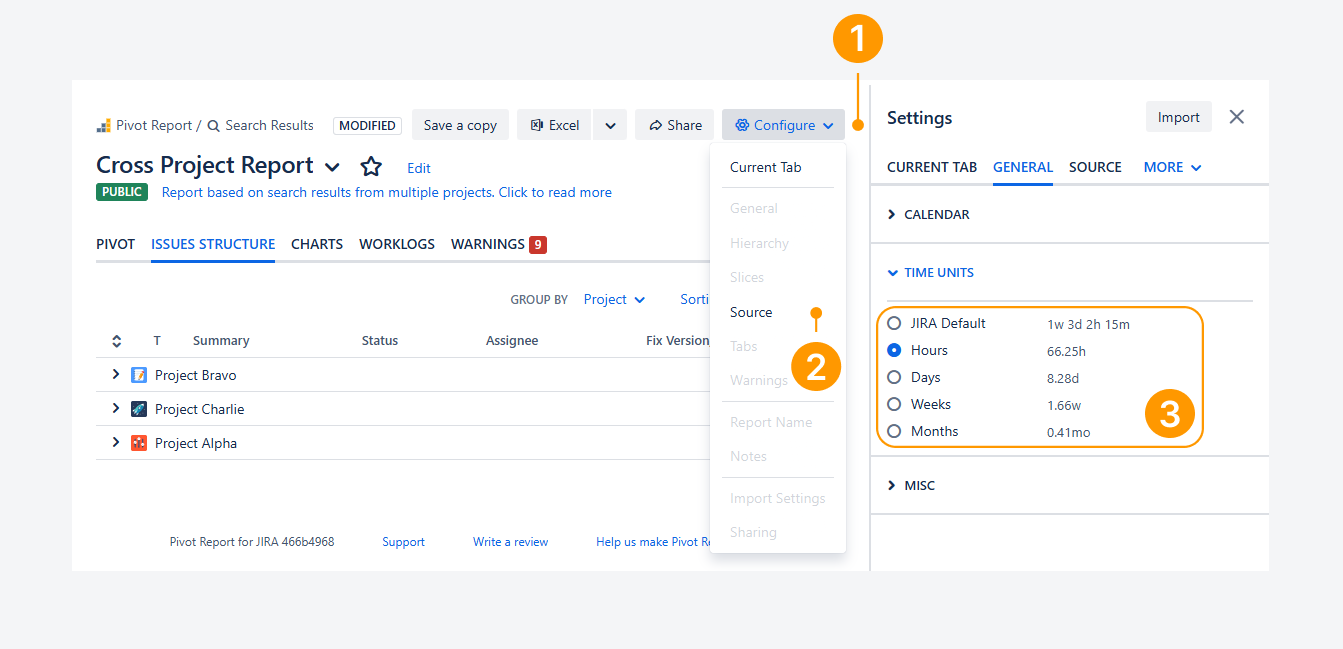
Yes. You can change how the four Time in Status fields appear by using the report sidebar. For example, you can switch between Jira’s default time-tracking format (such as 1w 3d 2h 15m) or display values in hours, days, weeks, or months.
To modify how these fields appear from the report sidebar in Jira:
-
Click Configure in the header section.
-
Select General from the dropdown.
-
Go to the Time units section.
How are these measurements different from Issues Lifetime?
Time in Status measurements show how long a work item remained within a specific status or status category during its lifecycle.
By comparison, the Work items Lifetime measurement shows how much time has passed since a work item's Created date and time until the current date and time. The value continues increasing until the work item is moved to Done (Resolved). Any other changes to the work item's status are not measured.
Also, the Work items Lifetime field is not affected by calendars that define working hours or working days, nor by time zone configurations.
-20260528-032419.png?cb=b5307ab17084dfe5cd361623f40c2e68)
In the example above, the Time in Status Group indicator shows that work items spent a combined total of more than 569 weeks in the In Progress status category. This total includes work items that are currently In Progress, work items that have since been completed, and work items that later returned to the To Do category.
By comparison, Work items Lifetime is displayed as a Value in the Summary section of the Pivot tab type. For the In Progress column, it measures the combined lifetime of only those work items that are currently in progress (Unresolved). These work items have existed for a total of 568 weeks since their creation.
As a result, Time in Status Group and Work items Lifetime measure different aspects of work item activity and should not be expected to produce the same values.
Troubleshooting
If you have questions or need assistance, contact our support team via email or service desk. Our team is available Monday through Friday (9:00 AM to 7:00 PM GMT+7) to help with technical challenges or discuss improvements.