
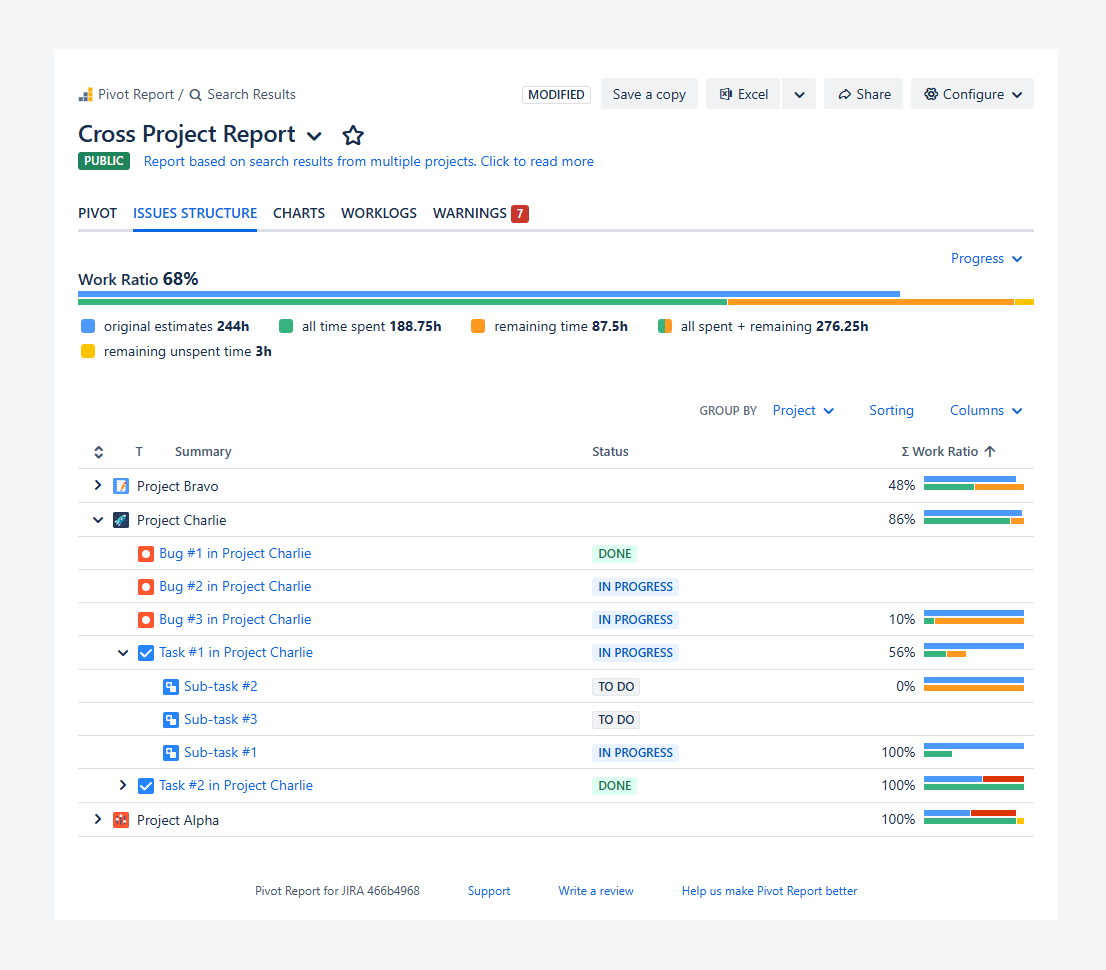
This article explains how to use Work Ratio indicator within the Progress, Summary, and Breakdown sections of a report, as well as within a widget displayed in the Work Item View.
Why should you use the Work Ratio?
The Work Ratio indicator helps you understand how much of the current estimate has been spent, rather than relying only on the original estimate. This makes it easier to measure progress when logged time and remaining time change, or when scope is added or removed.
For example, suppose you begin work on a task originally estimated at 10 hours. After spending 5 hours, you determine that more effort is required and increase the Remaining Time.
As a result, the combined total of Time Spent and Time Remaining increases from 10 hours to a current estimate of 15 hours.
The Work Ratio indicator expresses how much work has been completed relative to the current estimate.
It can be used as a measure of actual progress and compared against milestones or baseline target, such as reaching 50% completion by a certain date in a sprint or release. If the indicator falls behind the target, it can act as an early warning that the release may be at risk of delay.
How is the Work Ratio indicator calculated?
The Work Ratio is calculated using this formula:
Work Ratio = [Spent Time / (Spent Time + Remaining Time)] * 100%
What is shown within the indicator?
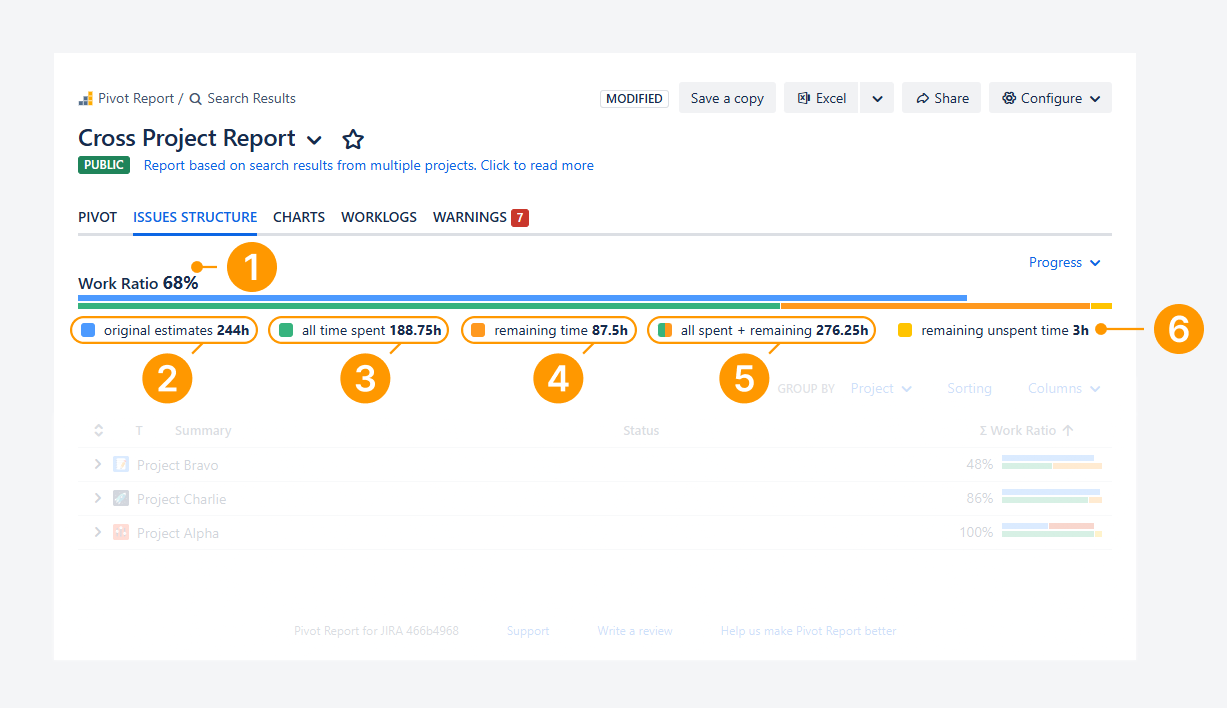
The Work Ratio progress indicator displays the following six elements:
-
Work Ratio: This value is obtained by dividing All time spent by All spent + remaining.
In the example, this equals 68% (188.75 / 276.25).
-
Original estimates: This value represents the estimated effort required to complete a work item or group of work items. When a work item is created, Time Spent is empty and Time Remaining matches the original estimate. The combined value of Time Spent and Time Remaining continues to match the original estimate until the estimate is exceeded or the work item is closed before all estimated effort is consumed.
In the example above, the total is 244 hours, based on the sum of estimates for all work items in the report.
-
All time spent: This value represents the total amount of time logged across work items.
In the example, the total logged time is 188.75 hours.
-
Remaining time: This reflects the work still to be completed. In many cases, Jira automatically reduces this value as time is logged. However, if the original estimate is exceeded, it can also be updated manually.
In the example, the remaining effort totals 87.5 hours.
-
All spent + remaining: This value represents the combined total of Time Spent and Time Remaining.
In the example, this equals 276.25 hours (188.75 + 87.5). When this value exceeds the Original Estimate, indicated by the stacked bar extending beyond the Original Estimate threshold, it signals that the estimate has been overspent.
-
Remaining unspent time: This value represents remaining time on closed work items where it was not reset to zero upon resolution or not manually updated.
In the example, this totals 3 hours.
Can you use the Work Ratio in a Widget?
Yes. The Work Ratio can be added to a widget. It allows you to track progress across an entire work item hierarchy and view rollup values, helping you identify potential estimate overruns.
-20260609-022859.png?cb=a83844ffe9aa51b5b426c1de1b6b185a)
The screenshot above shows the Work item View for a task where the Work item Tree and Work item Progress widgets are enabled.
-
Jira's child item table displays only part of the work item hierarchy and provides a limited view of overall progress.
For example, while Task SSPA-10 is in an In Progress status, its completion rate remains 0%, regardless of the status of its sub-tasks, which are not displayed in the table.
Even if one of the sub-tasks is completed, the completion rate does not increase. As a result, this table does not reliably represent progress across the entire hierarchy.
-
Jira's Time Tracking section also does not display cumulative Original Estimate, Time Spent, and Time Remaining values for the entire hierarchy, making it difficult to identify when an estimate has been exceeded.
For example, even when Include subtasks is enabled, this section shows only 1 hour logged and 4 hours remaining for Task SSPA-10 and does not include values from its sub-tasks.
-
In comparison, the ∑Work Ratio rollup field in the Work item Progress widget is displayed at every level of the hierarchy.
In this example, Sub-task SSPA-11 has a ∑Work Ratio of 100% even though it is not in a Done status. This indicates that the original estimate may be exceeded if additional time is logged.
-
The Work item Tree widget provides a broader view of progress across the hierarchy.
In the example shown, the ∑Work Ratio indicator shows that 28% of the epic's scope has been completed. The indicator also displays rollup values for Original Estimate, Time Spent, and Time Remaining across the entire hierarchy, including parent work items and their sub-tasks.
Features and use cases
Display the indicator as a rollup field for a project and its hierarchy
-20260606-012918.png?cb=f75061faada3b5cc2c6759d925b72253)
You can use ∑Work Ratio as a rollup field in the Progress section or as a column in the Summary or Breakdown section, as shown in the screenshot above.
-
The Work Ratio displayed in the Progress section is a rollup value for all work items included in the report. Its elements, such as Original Estimates, Time Spent, and Remaining Time, are also calculated as rollup values.
-
In the Summary section of the Work item Structure tab type, or similarly in the Breakdown section of another tab type, ∑Work Ratio can be displayed for each group. In the example shown, work items are grouped by space.. The ∑Work Ratio for Project Bravo is 48%, calculated from the cumulative Time Spent and Remaining Time values of Bug #1, Bug #2, Story #1, and Story #2.
-
Within each group, rollup values are also shown throughout the work item hierarchy. For example, Story #1, which is the parent of three sub-tasks, has a ∑Work Ratio of 46%.
Clicking a rollup value in either the hierarchy or a group opens a tooltip that displays the cumulative Time Spent and Remaining Time used in the calculation.
In the example above, the tooltip shows the combined values from Sub-task #1, Sub-task #2, and Sub-task #3, which are used to calculate the ∑Work Ratio for Story #1.
Display the indicator as a rollup field split per release and assignee
-20260606-021212.png?cb=8185cce32a4d7fd1af6b360b04267ba9)
You can use ∑Work Ratio as a rollup field in the Progress section or in the Summary section of a Pivot tab type, as shown in the screenshot above.
-
The Work Ratio of 68% displayed in the Progress section is a rollup value for all work items included in the report. Its components, such as Original Estimates, Time Spent, and Remaining Time, are also calculated as rollup values.
-
In the Summary section, the ∑Work Ratio subtotal for all work items is also 68%, matching the value shown in the Progress section. The Summary section also displays the ∑Work Ratio for each space and release. For example, Project Bravo has a ∑Work Ratio of 48%, while Release 1.0 has a ∑Work Ratio of 93%.
-
The Summary section can also display the ∑Work Ratio by assignee. In the example shown, Adam Grant has achieved 75% progress overall. Most of this progress comes from work completed in Project Charlie, where the ∑Work Ratio is 70%.
The closer a row value is to the column total, the higher its contribution in terms of hours to the ∑Work Ratio.
For example, Adam Grant has achieved 75% progress overall. However, even if Project Alpha is completed at 100%, it contributes fewer total hours than Project Charlie, where 70% of the work is completed.
This means that a space with a lower completion percentage can still have a greater impact on the overall Work Ratio if it contains a higher combined amount of Time Spent and Time Remaining.
FAQ
Can you remove or measure the Remaining Time when closing an issue?
Remove the Remaining Time when closing a work item
You can follow the steps described in a separate Atlassian article to add a workflow post function that automatically clears the Remaining Time field when a work item transitions to Done.
By clearing this field for closed work items, you can track cumulative remaining hours within a sprint, release, or space. This also supports burndown charts, helping you assess whether you are on track to deplete all estimated hours by the target date.
If you want to track work items that were overestimated, you can enable Estimate Accuracy or Time Budget as indicators in the Progress section, or as rollup fields in the Summary or Breakdown sections.
Measure the Remaining Time when closing a work item
-20260606-044752.png?cb=0644705c0c563a4d93bf41e4d9ba5231)
If you retain Remaining Time for closed work items, you can display it through the following indicators and rollup fields.
-
The Work Ratio progress indicator shows the cumulative remaining unspent time.
-
The ∑ Unspent field displays the remaining unspent time per closed work item and per group. In the example above, there are 3 hours of remaining unspent time for closed work items. This indicates that 3 hours were overestimated for Story #1 and Project Alpha, which includes it.
In comparison, the ∑ Remain. Open rollup field shows the remaining time for open tasks.
In the example, the sum of ∑ Remain. Open values from Project Bravo (75h) and Project Charlie (12.5h) matches the total remaining time of 87.5 hours shown in the Work Ratio indicator in the progress section.
Why is Work Ratio 100% once the issue is closed?
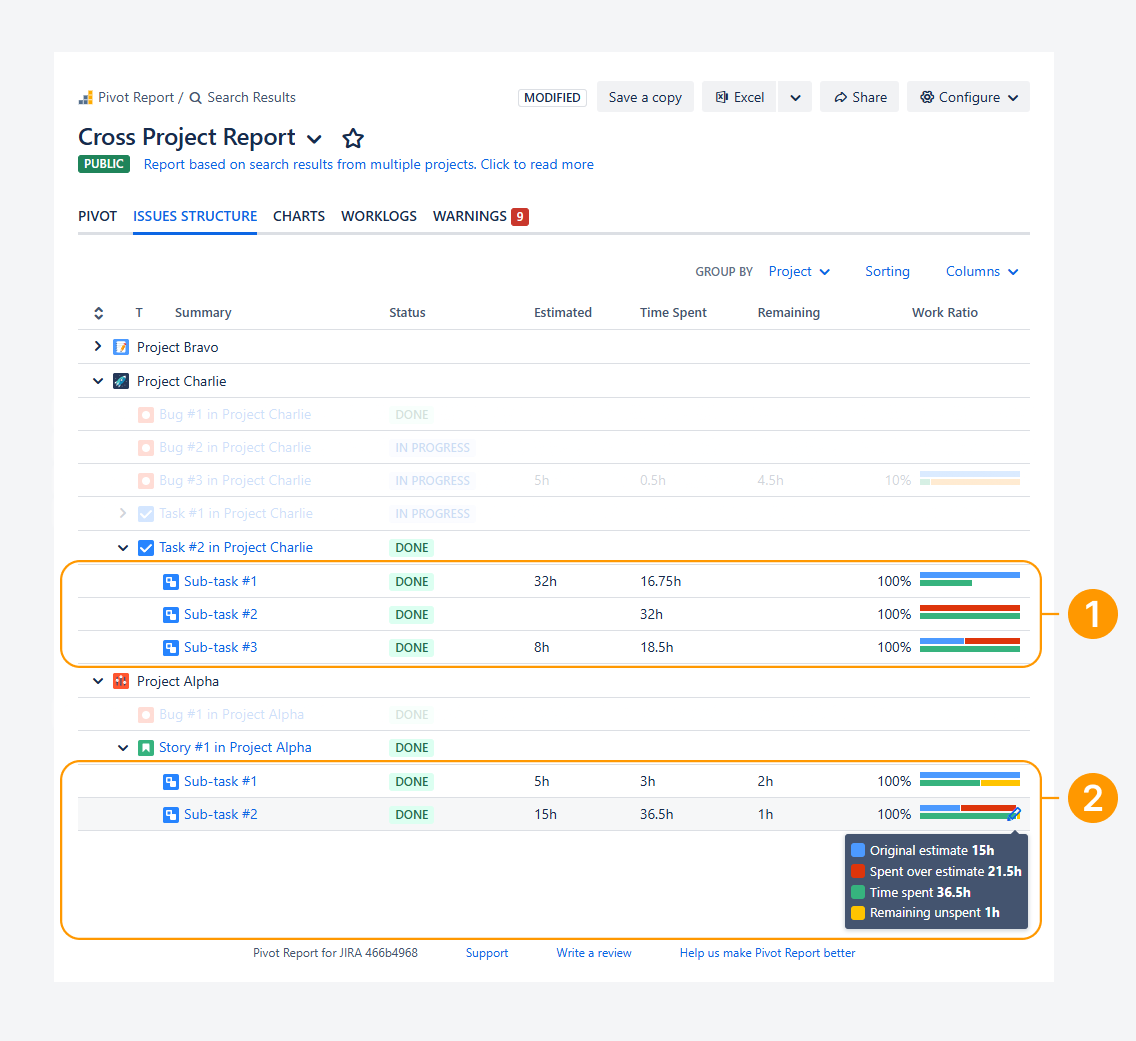
The screenshot above shows examples of how Work Ratio is calculated for closed work items, both when there is no remaining time and when remaining time still exists.
-
In the first example, the Work Ratio is 100% because the sub-tasks are closed and no Remaining Time remains.
-
In the second example, the Work Ratio is also 100% because the sub-tasks are closed. Although some Remaining Time still exists, it is categorized as Remaining Unspent Time, as shown in the tooltip. It is not considered unfinished work.
Does the Work Ratio increase or decrease when scope is removed?
The following are two examples showing cases of an increase and decrease in ∑Work Ratio, along with their causes.
Increase in ∑Work Ratio
-20260604-025037.png?cb=b4523e6bd31103233739dbdf6f3cb7af)
The ∑Work Ratio rollup field, which includes child items in its calculation, can increase when scope is reduced, such as when child items are removed.
For example, the ∑Work Ratio for Story #1 is 46% (59 hours of Time Spent out of 128 hours total, where 128 hours equals 59 hours spent plus 69 hours remaining across all three sub-tasks).
When Sub-task #2 is removed or descoped from Story #1, the ∑Work Ratio increases to 64% (59 hours of Time Spent out of 92 hours total, where 92 hours equals 59 hours spent plus 33 hours remaining across the two remaining sub-tasks).
This increase is mainly due to Sub-task #3 being closed and having no remaining hours.
If no time had been spent on Sub-task #3 and either 33 or 45 hours had remained, the ∑Work Ratio for Story #1 would have been lower than 46% after removing Sub-task #2.
Decrease in ∑Work Ratio
-20260604-031415.png?cb=7c62c45cd35fd591ddf7c3ad58bfff92)
However, the ∑Work Ratio can also decrease when a child item is removed.
For example, the ∑Work Ratio for Story #2 is 75% (12 hours of Time Spent out of 16 hours total, where 16 hours equals 12 hours spent plus 4 hours remaining across three sub-tasks).
When Sub-task #2 is removed or descoped from Story #2, the ∑Work Ratio decreases to 56% (4.5 hours of Time Spent out of 8 hours total, where 8 hours equals 4.5 hours spent plus 3.5 hours remaining across the two remaining sub-tasks).
This decrease is mainly due to the absence of estimated or tracked time associated with Sub-task #3.
∑Work Ratio may also change when new work items are added, even when these additions are not considered scope changes. This includes, for example, bugs identified by the development team or incidents reported by external users.
Troubleshooting
Why are issues missing in the Pivot tab, and how is the Work Ratio impacted?
-20260606-025347.png?cb=2c9d16a018340cb5a51d041bc76708ed)
In the example above, Project Bravo contains 10 work items, but only 3 work items are shown in Release 1.1 and 2 work items are shown in Release 1.0. The remaining work items are hidden because a row-filtering setting is enabled in the report sidebar.
This setting affects only the rows displayed in the Pivot tab. It does not affect the calculations used for the Work Ratio. As a result, the ∑Work Ratio for Project Bravo remains 48%, regardless of whether the hidden rows are displayed.
To show the hidden rows, follow these steps:
-
Click Configure in the report header.
-
Select Current tab from the dropdown menu.
-
In the Rows section, disable Hide rows with empty values (all slices).
After disabling this setting, rows with None, Empty, or Unassigned values become visible.
-20260606-031517.png?cb=4c2cc1ab6e535debbae15c6477195d67)
-
In the example shown below, the previously hidden None row becomes visible and contains 5 work items that are not assigned to a release.
-20260606-032357.png?cb=0294c850b40258a131c1112c417479ea)
Although additional rows are displayed, the calculations remain unchanged. The overall ∑Work Ratio across all spaces and releases remains 68% for 25 work items, and the ∑Work Ratio for Project Bravo remains 48%.
If you have questions or need assistance, contact our support team via email or service desk. Our team is available Monday through Friday (9:00 AM to 7:00 PM GMT+7) to help with technical challenges or discuss improvements.