
This article explains why and how to add gadgets, which are linked to an existing report, to a dashboard.
Why should you use gadgets?
By using dashboard gadget linked to a report, you can display the contents of report tabs and sections, without having to load the entire report. Also, you open filter the data by click on the labels or color-coded bars with each gadget, allowing you access a deeper breakdown of the results presented.
For example, you are using a dashboard per project and version and using the Work Ratio, within the Progress gadget, to track how work it progressing.
Within the dashboard, you have a Summary gadget showing Warnings related to activities where assigned time is overspent.
How can you add gadgets?
There are five types of gadgets that can be added to a dashboard. Each gadget can be linked to the same saved report or to different reports. The steps for adding each type are listed below.
|
Gadget |
Description |
|---|---|
|
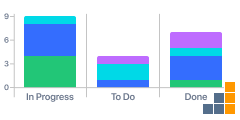
Pivot Report charts displays preconfigured charts from saved reports. |
|
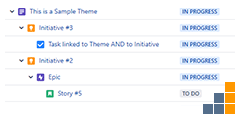
Pivot Report Issues Structure shows the full hierarchy from the Issues Structure tab in your report. |
|
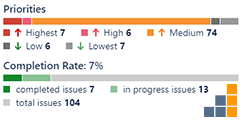
Pivot Report Progress shows the progress indicators you select when configuring the gadget. |
|
Pivot Report Slices displays preconfigured slices from saved reports. |
|
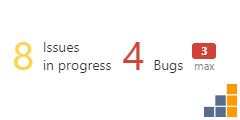
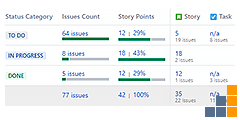
Pivot Report Summary displays preconfigured content from the Pivot, Worklogs, Capacity, or Warnings tab of a saved report. |
Charts
The Charts gadget lets you view charts and open their details directly from a dashboard. You can check the filtered contents of any indicator without opening the source report. Select a label or a color-coded bar, and a Breakdown section will open in a new browser tab.
To add it:
-
Open Dashboards from the sidebar, choose View all dashboards, and open the one you want to edit.
-
Click Edit.
-
Click Add gadget.
-
Use the gadget wizard and type Colined in the search bar to find the gadget.
-
Select Add next to Pivot Report Charts.
-
Choose the report that provides data to the gadget.
-
Choose the Slice that filters the content
-
Choose the Slice that filters the content. The default is All Issues.
-
Select how charts are grouped in rows and columns and whether to display their legends.
-
Click Save.
Issues Structure
The Issues Structure gadget lets you view and open items in your hierarchy directly from a dashboard. You can see the full structure without opening the source report, and you can review the issues under a parent item without using the Issue Navigator.
To add it:
-
Open Dashboards from the sidebar, choose View all dashboards, and open the one you want to edit.
-
Click Edit.
-
Click Add gadget.
-
Use the gadget wizard and type Colined in the search bar to find the gadget.
-
Select Add next to Pivot Report Issues Structure.
-
Choose the report that provides data to the gadget.
-
Choose the Slice that filters the content. The default is All Issues.
-
Choose the Columns to show, how the data is Grouped and Sorted, and how many hierarchy levels to display.
-
Click Save.
Progress indicators
The Progress gadget lets you view progress indicators and open their details directly from a dashboard. You can check the filtered contents of any indicator without opening the source report. Select a label or a color-coded bar, and a Breakdown section will open in a new browser tab.
To add it:
-
Open Dashboards from the sidebar, choose View all dashboards, and open the dashboard you want to edit.
-
Click Edit.
-
Click Add gadget.
-
In the gadget wizard, type Colined in the search bar to find the gadget.
-
Select Add next to Pivot Report Progress.
-
Choose the report that will provide data to the gadget.
-
Choose the Slice that filters the content. The default option is All Issues.
-
Select which progress indicators to display, how they are grouped in rows and columns, and how they will be sorted.
-
Click Save.
Slices
The Slices gadget lets you view Slice values and open them directly from a dashboard. You can see the filtered contents without opening the source report. Click a Slice, and a Breakdown section will open in a new browser tab.
To add it:
-
Open Dashboards from the sidebar, choose View all dashboards, and open the dashboard you want to edit.
-
Click Edit.
-
Click Add gadget.
-
In the gadget wizard, type Colined in the search bar to find the gadget.
-
Select Add next to Pivot Report Slices.
-
Choose the report that will provide data to the gadget.
-
Select whether to hide the All Issue slice and whether to show slices without any issues.
-
Click Save.
Summary
The Summary gadget lets you view information available in the Pivot, Worklogs, Capacity, or Warnings tabs and open their details directly from a dashboard. You can check the filtered contents without opening the source report. Click a label or hyperlinked text, and a Breakdown section will open in a new browser tab.
To add it:
-
Open Dashboards from the sidebar, choose View all dashboards, and open the dashboard you want to edit.
-
Click Edit.
-
Click Add gadget.
-
In the gadget wizard, type Colined in the search bar to find the gadget.
-
Select Add next to Pivot Report Progress.
-
Choose the report that will provide data to the gadget.
-
Choose the Slice that filters the content. The default option is All Issues.
-
Select which progress indicators to display, how they are grouped in rows and columns, and how they will be sorted.
-
Click Save.
FAQ
Troubleshooting
What you do when encountering a server disruption error?
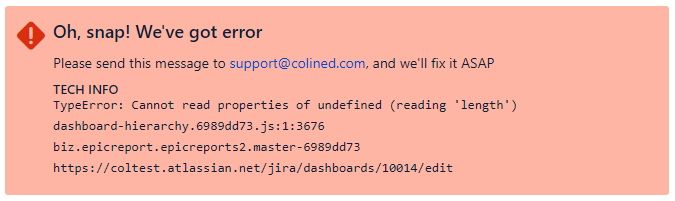
A service disruption error can appear when the gadget’s source is set to a tab that was removed from the report, such as in the case of a Charts gadget.
To troubleshoot this gadget settings error, follow these steps:
-
Open the dashboard you want to edit, and click Edit.
-
Click the actions (•••) menu in the top-right corner of the gadget.
-
Select Configure.
-
Click Save.
-
If the error continues, select Configure again and choose another report from the Saved Pivot Report dropdown.
-
Reselect the report you want to use.
-
Click Save.
To receive assistance for the error, please send a screenshot of the gadget with the error code and the HAR files to support@colined.com. The steps for generating a HAR file are mentioned in a related article.
What you do when encountering a configuration error?

A configuration error usually occurs when a gadget is not fully configured or when prior configurations not longer apply.
Re-select the gadget source
To troubleshoot this error, start by re-selecting the report used as the gadget source:
-
In a Dashboard, click Edit.
-
Click the actions (•••) menu in the top-right corner of the gadget and select Configure.
-
Check the Saved Pivot Report field:
-
If it is empty, select the desired report from the Select source report dropdown.
-
If it already has a report selected, use the dropdown to re-select the desired report.
-
If the desired report does not appear in the dropdown, follow the procedure in the related article to restore access.
Verify the report source
After re-selecting the report, verify the report source:
-
Click Configure in the header and select Source from the dropdown.
-
Perform the required actions based on the source type:
-
Project, Board, Saved Filter, or Issue: Ensure you have access to the source by locating and adding it from the dropdown.
-
JQL: Ensure you have access to the query results. For example, if the query points to a project, verify that you have permission to view the issues in that project.
-
If you have limited to a source used in the report, follow the related article procedure to restore access.
What you do when encountering a permissions error?
Below is a list of errors caused by permission changes. When you or a teammate updates dashboard permissions, any user who cannot access the dashboard will also be unable to use the gadgets added to it.
In contrast, changes to a report or its source affect gadget use indirectly. Errors caused by these changes must be fixed in the report or in its source before you can confirm that the gadget is working correctly on the dashboard.
Dashboard permission error
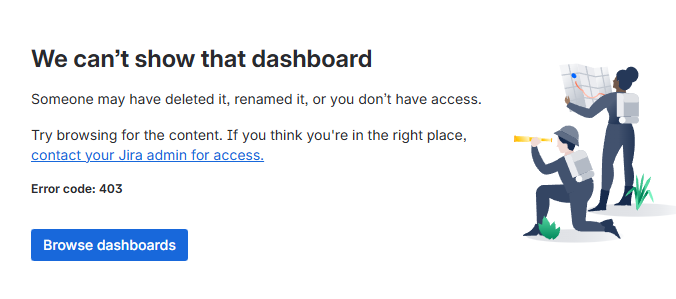
If the error above appears, contact your Jira admin or the dashboard owner. You don’t have permission to view the dashboard or the gadgets displayed on it.
Report permission error

If you can access the dashboard but see this error, it means you do not have access to the report used as the gadget’s source. Contact the report owner, an admin, or the groups with access to request permission. A related article explains the steps to restore access to a report.
Report source permission error

If you see this type of error, it means you cannot access the report because its source is either unavailable to you or has been deleted.
For example, if a filter is made private or removed, any report that uses it as a source becomes inaccessible to users who cannot view that filter. As a result, an error appears in the report and in any gadgets linked to it.
Likewise, if a filter is made private or deleted, any board that relies on that filter will appear empty to users without access. Reports based on that board, and gadgets linked to those reports, will also show an error.
A related article explains how to restore access to a report source.
What you do when encountering a report deletion error?

If you see this type of gadget error, it means you cannot access the report because it is deleted.
For example, a gadget is configured to reference report B, which is a copy of report A. Report B is deleted within the same week, while the other report is unaffected. When accessing report B or using gadgets associated to it, an error appears.
If you have questions or need assistance, contact our support team via email or service desk. Our team is available Monday through Friday (9:00 AM to 7:00 PM GMT+7) to help with technical challenges or discuss improvements.