
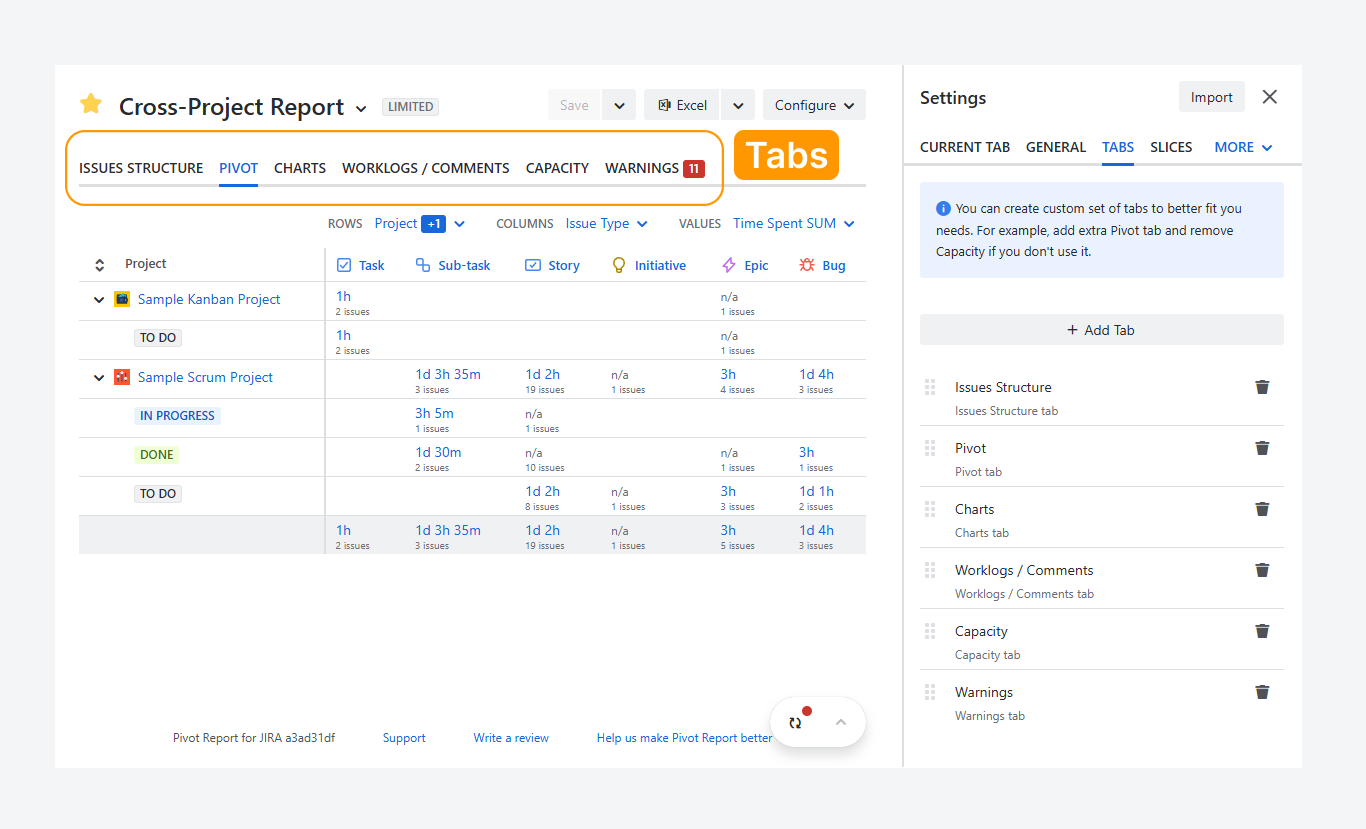
Like the six faces of a cube, each of the tab types provides a different way to explore your data and gain insights into the overall shape of your projects.
Why should you use tabs?
Tab types lets you explore your data in greater depth to identify dependencies, recurring blockers, time drains, commitments that exceed capacity, and early indicators of project deviation.
Which tab types are available to you?
By default, a newly created report includes six tab types.
Issues Structure
-20260325-150607.png?cb=9bb6036d2a3d5c3b368c638247beed95)
The Issue Structure tab type acts as an enhanced version of Jira’s Issue Navigator. It lets you display the issue hierarchy (such as Epic → Story → Sub-task) or a custom hierarchy built within the report.
You can also view rollup fields, such as ∑ Remaining Estimate, and relationship links, such as Blocked by. This allows you to explore a personalized issue tree and identify blockers without leaving the report. To learn more about this tab type, refer to this related article.
Pivot
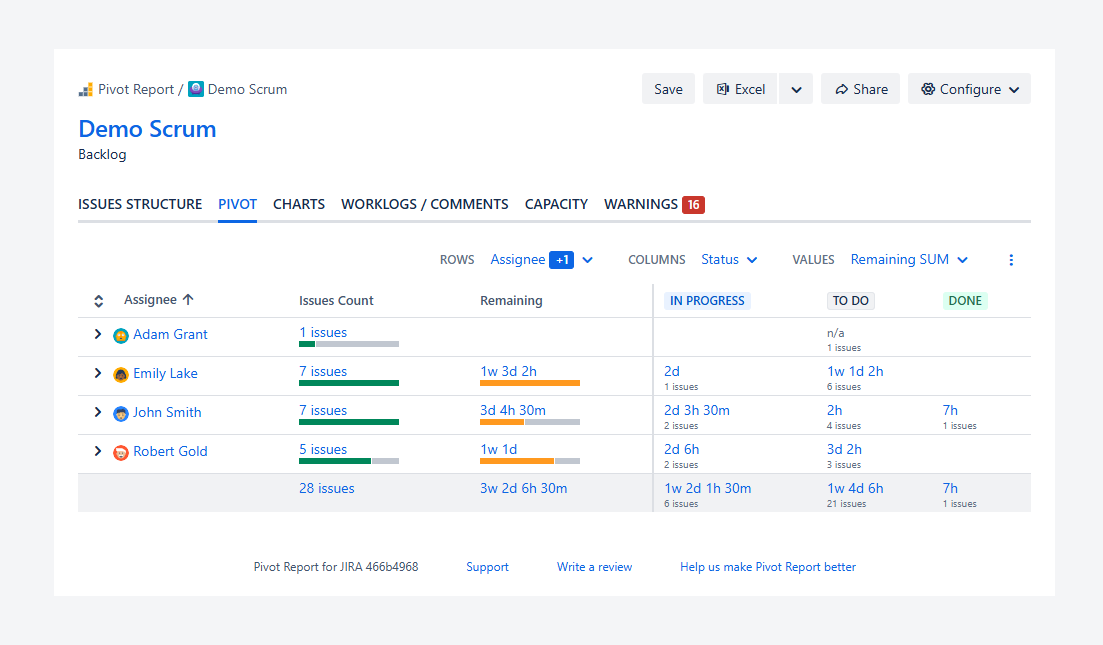
The Pivot tab type, one of the most popular of the six types, allows you to group and summarize fields. This tab type is often used as a starting point for answering “what if” questions and for analyzing work progress or preparing a project retrospective.
For example, in just three clicks, you can see the number of issues per assigned, their remaining time, and their status, as shown in the screenshot. To learn more about this tab type, refer to this related article.
Charts
-20260319-013201.png?cb=a5f3ccc6ac8956ec1ca5218315b1d0e4)
The Charts tab lets you visualize data using two or three axes, with bars, lines, or bubbles. This helps you understand the relative impact of each field.
In the example above, you can compare time spent with the original estimate for each status category.
The chart shows that delivered (Done) issues may include logged time without an estimate, while some issues not yet started (To Do) already have time spent that exceeds the original estimate. To learn more about this tab type, refer to this related article.
Worklogs/Comments
-20260319-021021.png?cb=ad58deb21452dcfc2b01e7552b64fefd)
The Worklogs tab type serves two main purposes.
First, it lets you create reports focused on issue comments.
For Jira Service Management (JSM) projects, you can distinguish between internal and external comments. You can also tabulate the number of comments, by type, per issue or by any other available field.
Second, if you use Jira time tracking, the Worklogs tab lets you analyze time logged for an issue by user and by time interval. Unlike the Pivot tab, it allows you to filter worklogs directly based on who logged the time and when it was logged.
To learn more about this tab type, refer to this related article.
Capacity
-20260319-014803.png?cb=94432e8ac0ca52ec2400387c239540d5)
The Capacity tab type lets you monitor capacity per assignee based on each issue’s Due Date (or another date field) and remaining hours, within a selected date range and interval (weekly, biweekly, or monthly).
You can click any element to update the assignee or due date for future deliverables in the issue view pop-up. This helps you adjust capacity and then refresh the report without reloading the page. To learn more about this tab type, refer to this related article.
Warnings
-20260218-062253.png?cb=74dcd07f92f85e2400eefa58a2c632d5)
The Warnings tab type lets you flag issues in a report by enabling common scenarios that may impact project delivery. For example:
-
In the screenshot above, several warning types are enabled in the Warnings tab.
-
In the Pivot tab, these warning types appear next to each flagged issue through the Warnings column.
To learn more about this tab type, refer to this related article.
Features and use cases
Use the same type multiple times and rename it
You can use the same tab type more than once. In the example below, the Pivot tab type is used three times.
Each tab has a different name and configuration to analyze the data in a different way, while using the same tab type and report source.
-20260316-231536.png?cb=1414f6cd8f62ce6d6872ffcac17a2e3c)
This example is available as a demo and can help you add more tabs with custom names.
FAQ
Can you change the type of an existing tab by renaming it?
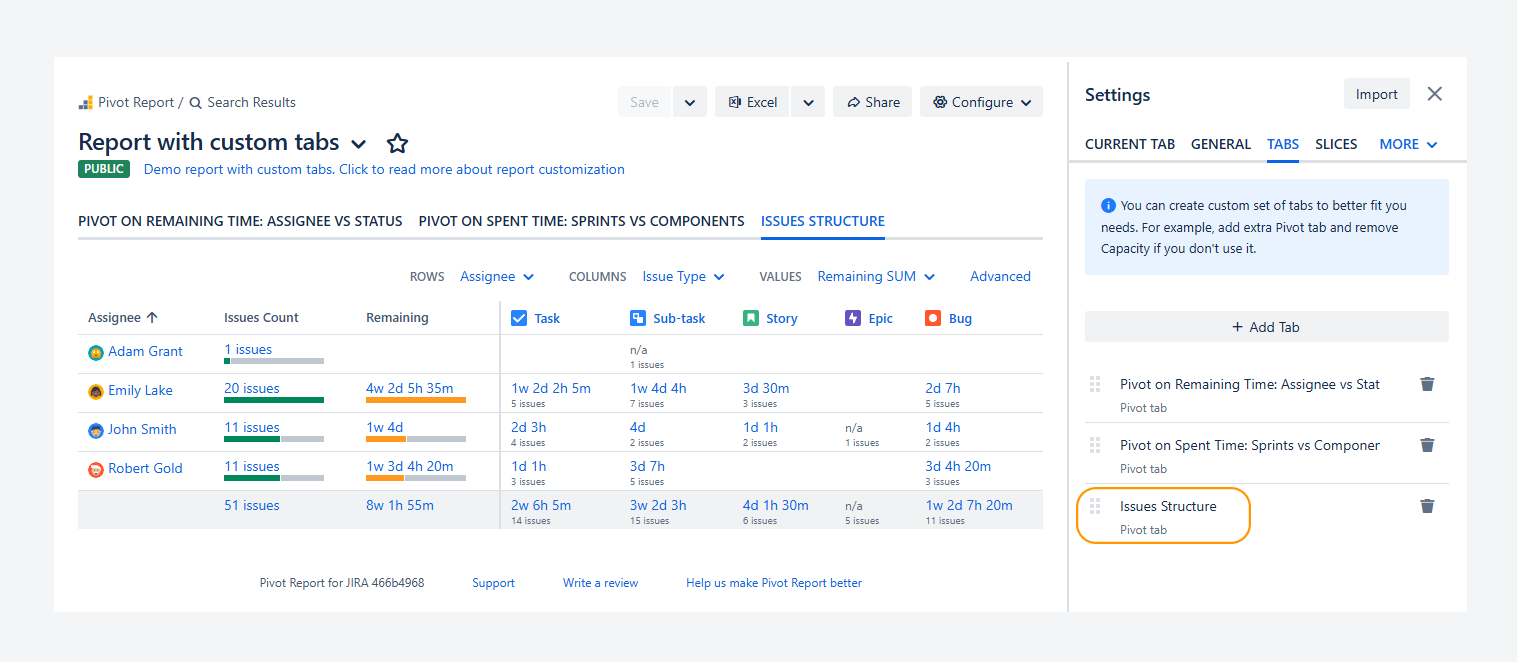
No. Renaming a tab does not change its type, as shown in the screenshot above.
For example, the Pivot tab type is used three times. Even if the third tab is renamed Issues Structure, its type remains Pivot.
To add a different tab type, follow the steps in a separate article.
How can you determine the type of existing tabs?
You can verify the type of existing tabs in the report sidebar, as shown in the screenshot above.
For example, the Pivot tab type is used three times, even though the third tab is renamed Issue Structure.
To access these settings, follow the steps in a separate article.
Troubleshooting
A Warnings tab type is missing. Where can you find it?
If the Warnings tab is missing, as shown in the screenshot above, it may have been removed from the report’s section tabs.
To add a tab, follow the steps in a separate article.
If you have questions or need assistance, contact our support team via email or service desk. Our team is available Monday through Friday (9:00 AM to 7:00 PM GMT+7) to help with technical challenges or discuss improvements.