
Dear Pivoters,
Over the past several months, we’ve been hard at work developing a range of new features and enhancements to make your experience even better. Your continuous support and valuable feedback have been instrumental in shaping our product, and we are excited to introduce these significant updates that reflect your needs and ideas.
Thank you for being a part of our journey and for helping us make Pivot Report better with each release.
Comments Focused reporting
In our latest release of Pivot Report for Jira, we are excited to introduce a major enhancement focusing on Comments.
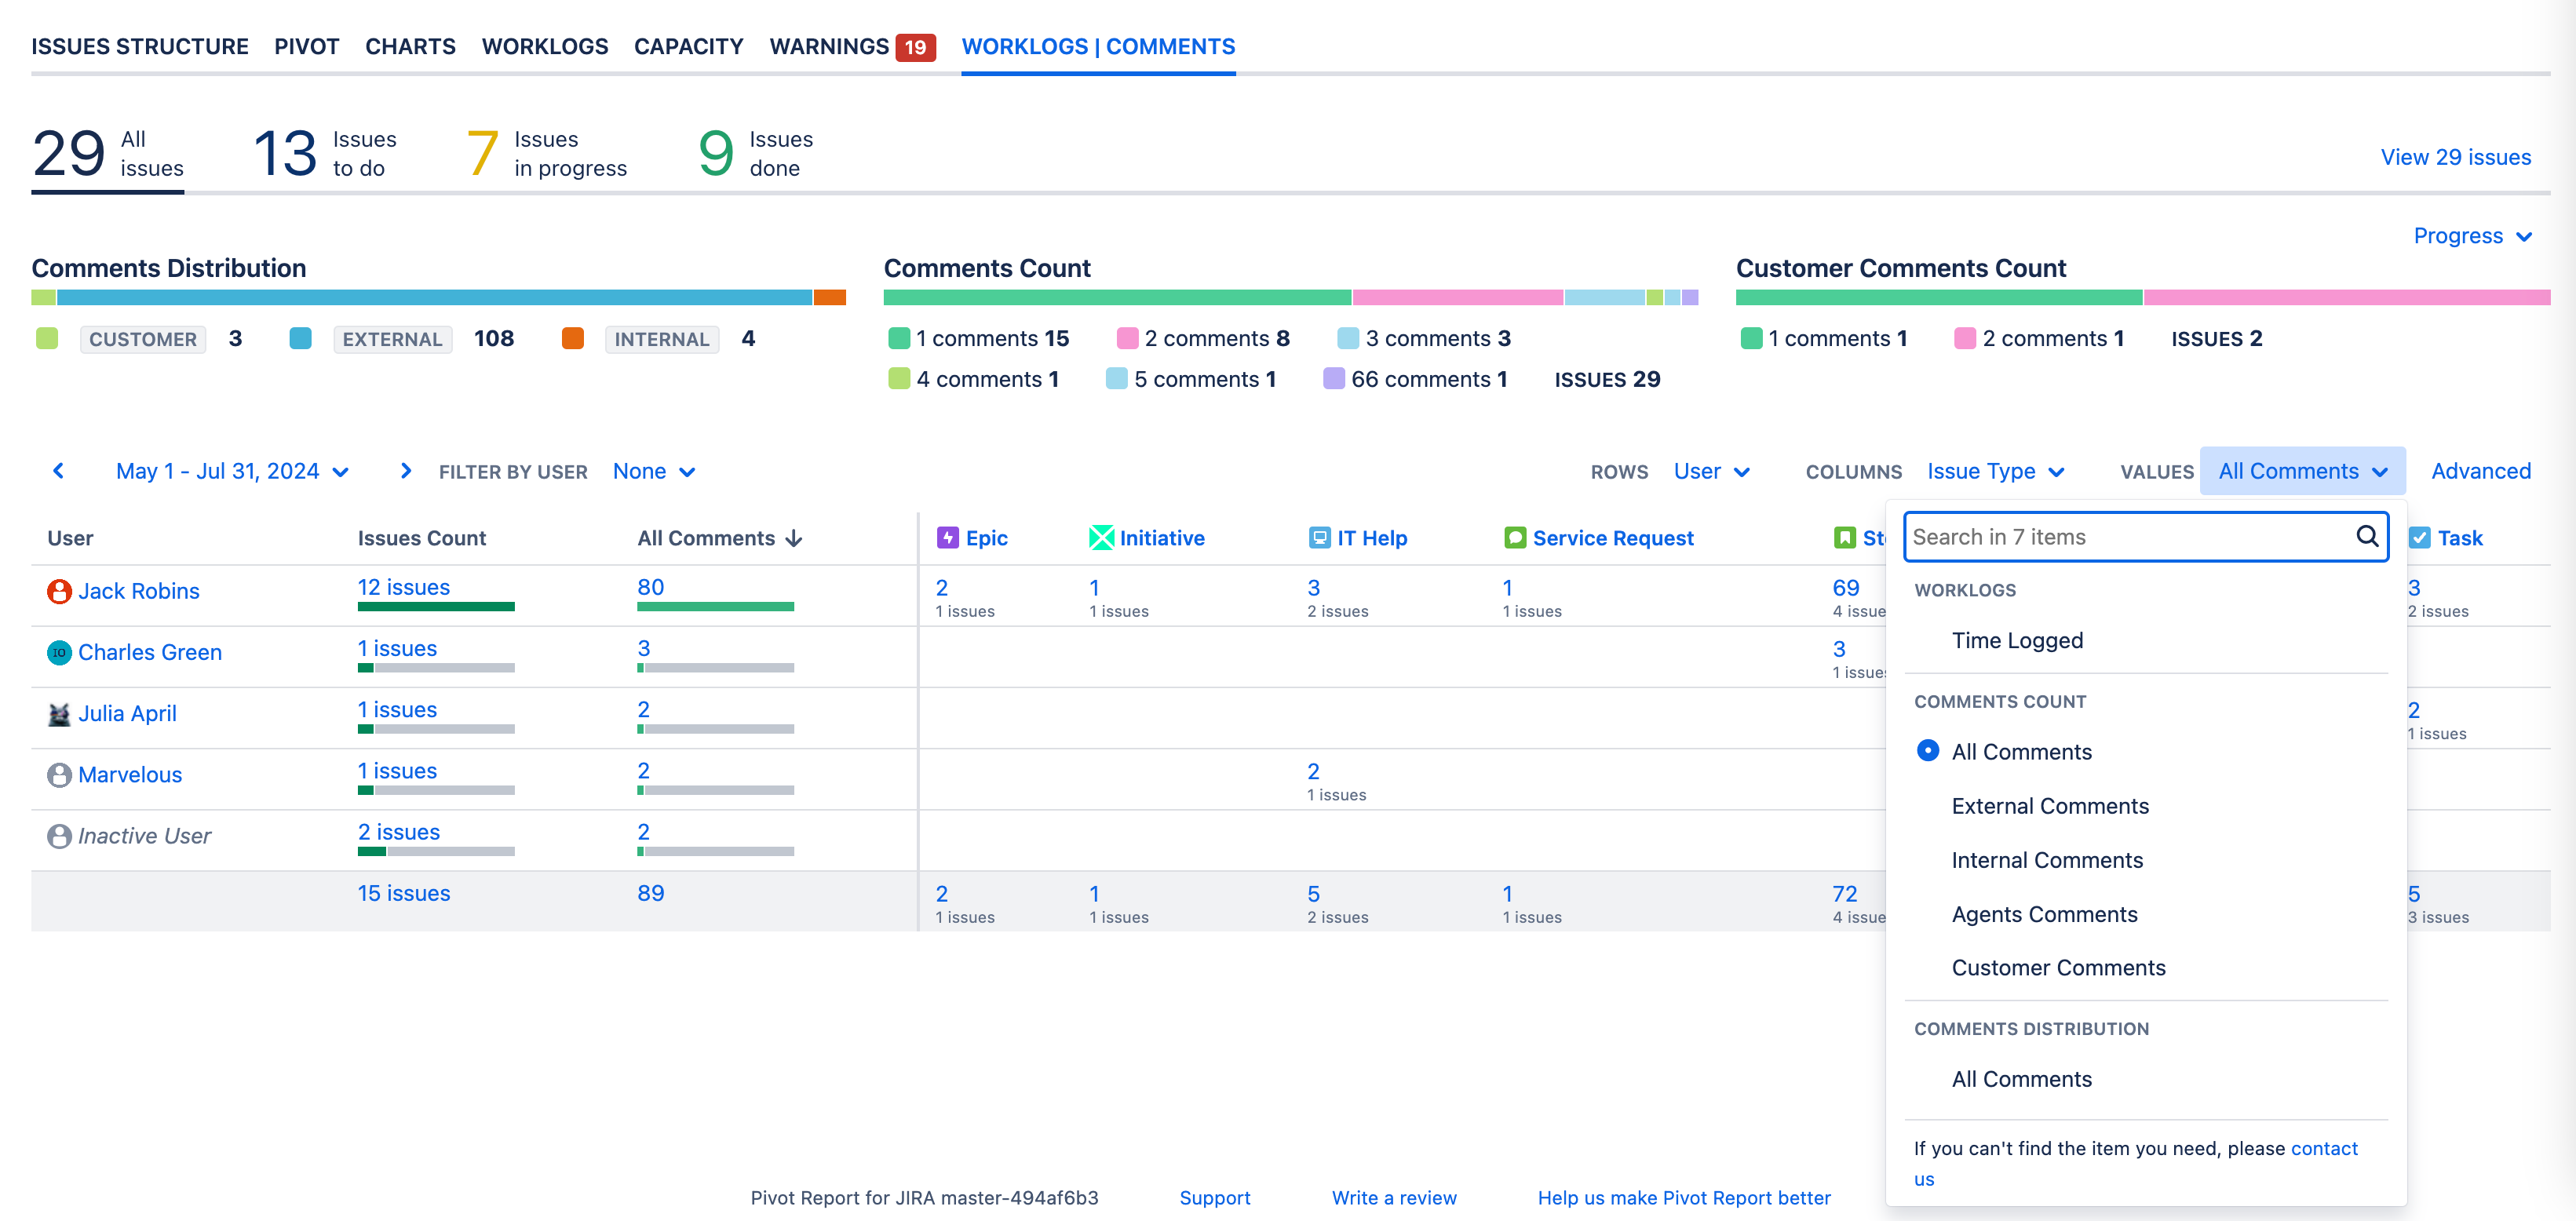
Previously, our Worklogs tab allowed users to report on time-logged entries.
With this new update, we’ve expanded the functionality by adding a dedicated mode for reporting on comments made by Jira users, external customers, and Jira service management (JSM) agents within a specified date range.
This feature is designed to provide a more comprehensive view of communication within your projects, ensuring that no critical information slips through the cracks.
Furthermore, Pivot Report now supports a variety of comment-related columns to enhance your reporting capabilities. These include columns for the first and last comment, the date a comment was made or modified, and the type of comment.
This allows users to generate detailed reports that can track the flow of discussions and identify key points of interaction.
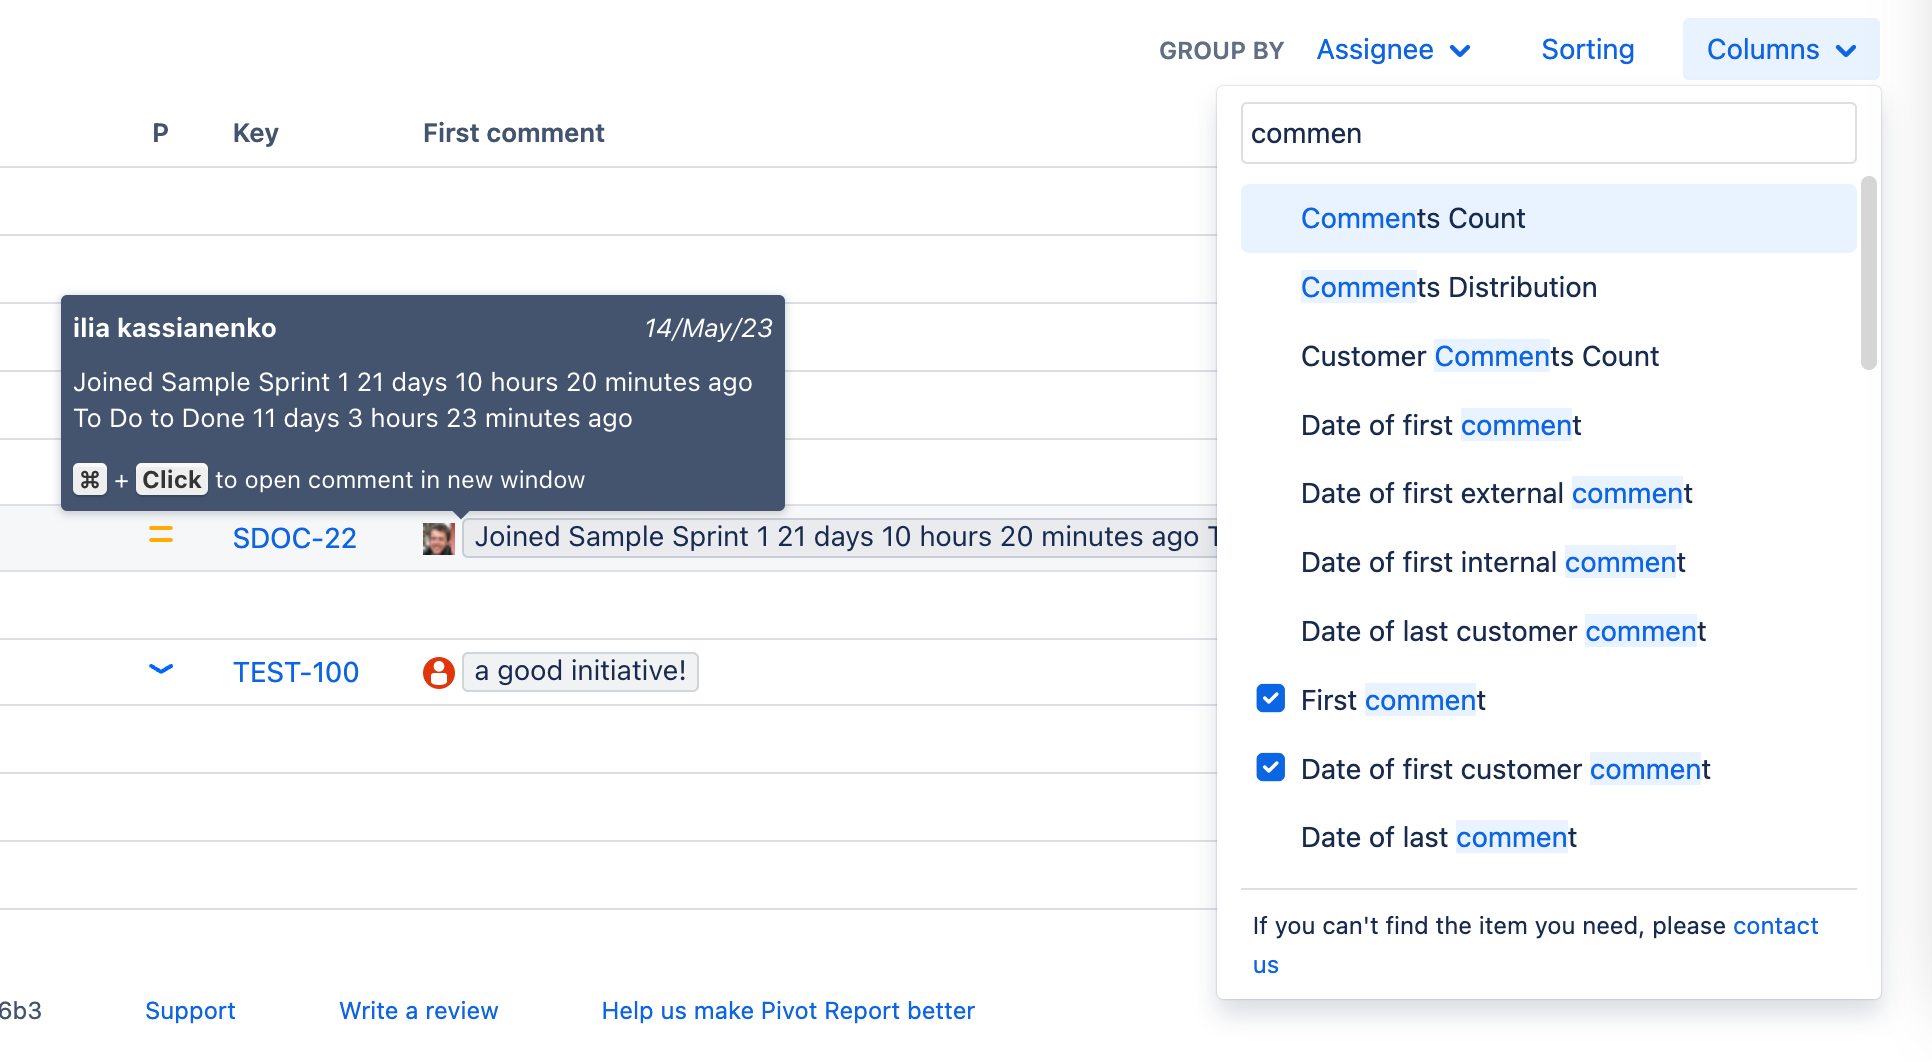
On top of that we added several progress indicators related to comments, such as Comment Type, Comment Count and more.
Whether you need to monitor customer feedback, track agent responses, or analyze user interactions, this new feature offers the tools necessary to gain deeper insights and improve overall project management.
Grouping in Issue Structure Tab
We are excited to introduce a new grouping feature to the Issue Structure tab, enhancing its flexibility and usability. This feature allows you to group top-level issues in a similar way to what we have implemented for the Pivot tab.
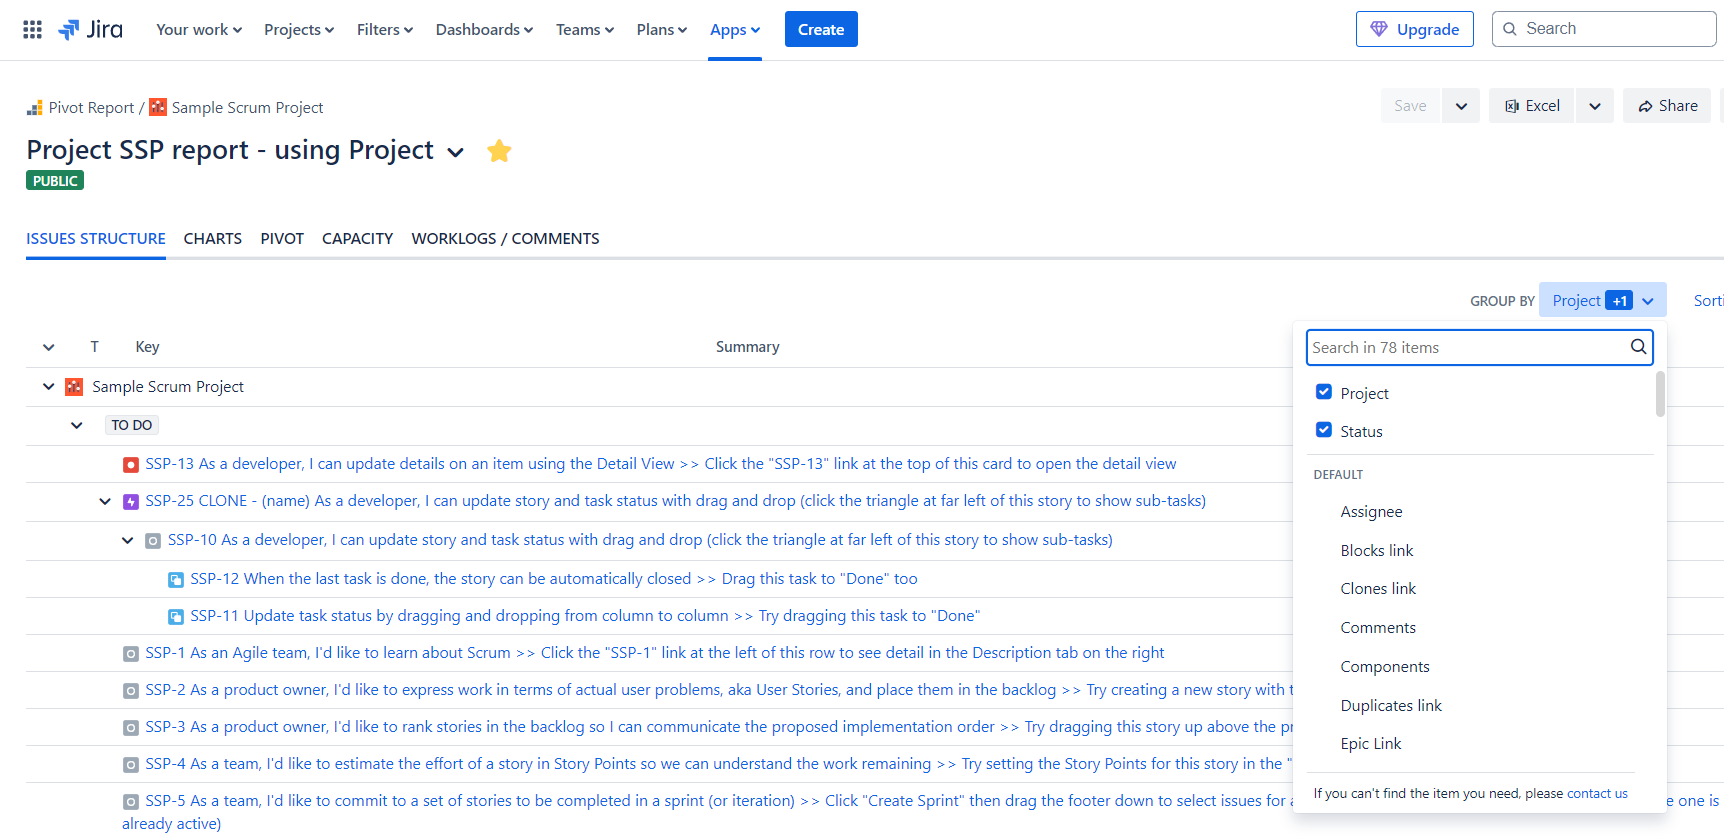
Grouping in the Issue Structure tab enables you to create customized views that reflect your unique project needs.
Embedding reports into Confluence and Web pages
We understand that many of our users need to access their reports outside of the Jira environment, in applications like Confluence or custom web pages. Responding to this demand, we have introduced a new feature that allows you to embed reports as an iframe, within Jira Cloud.
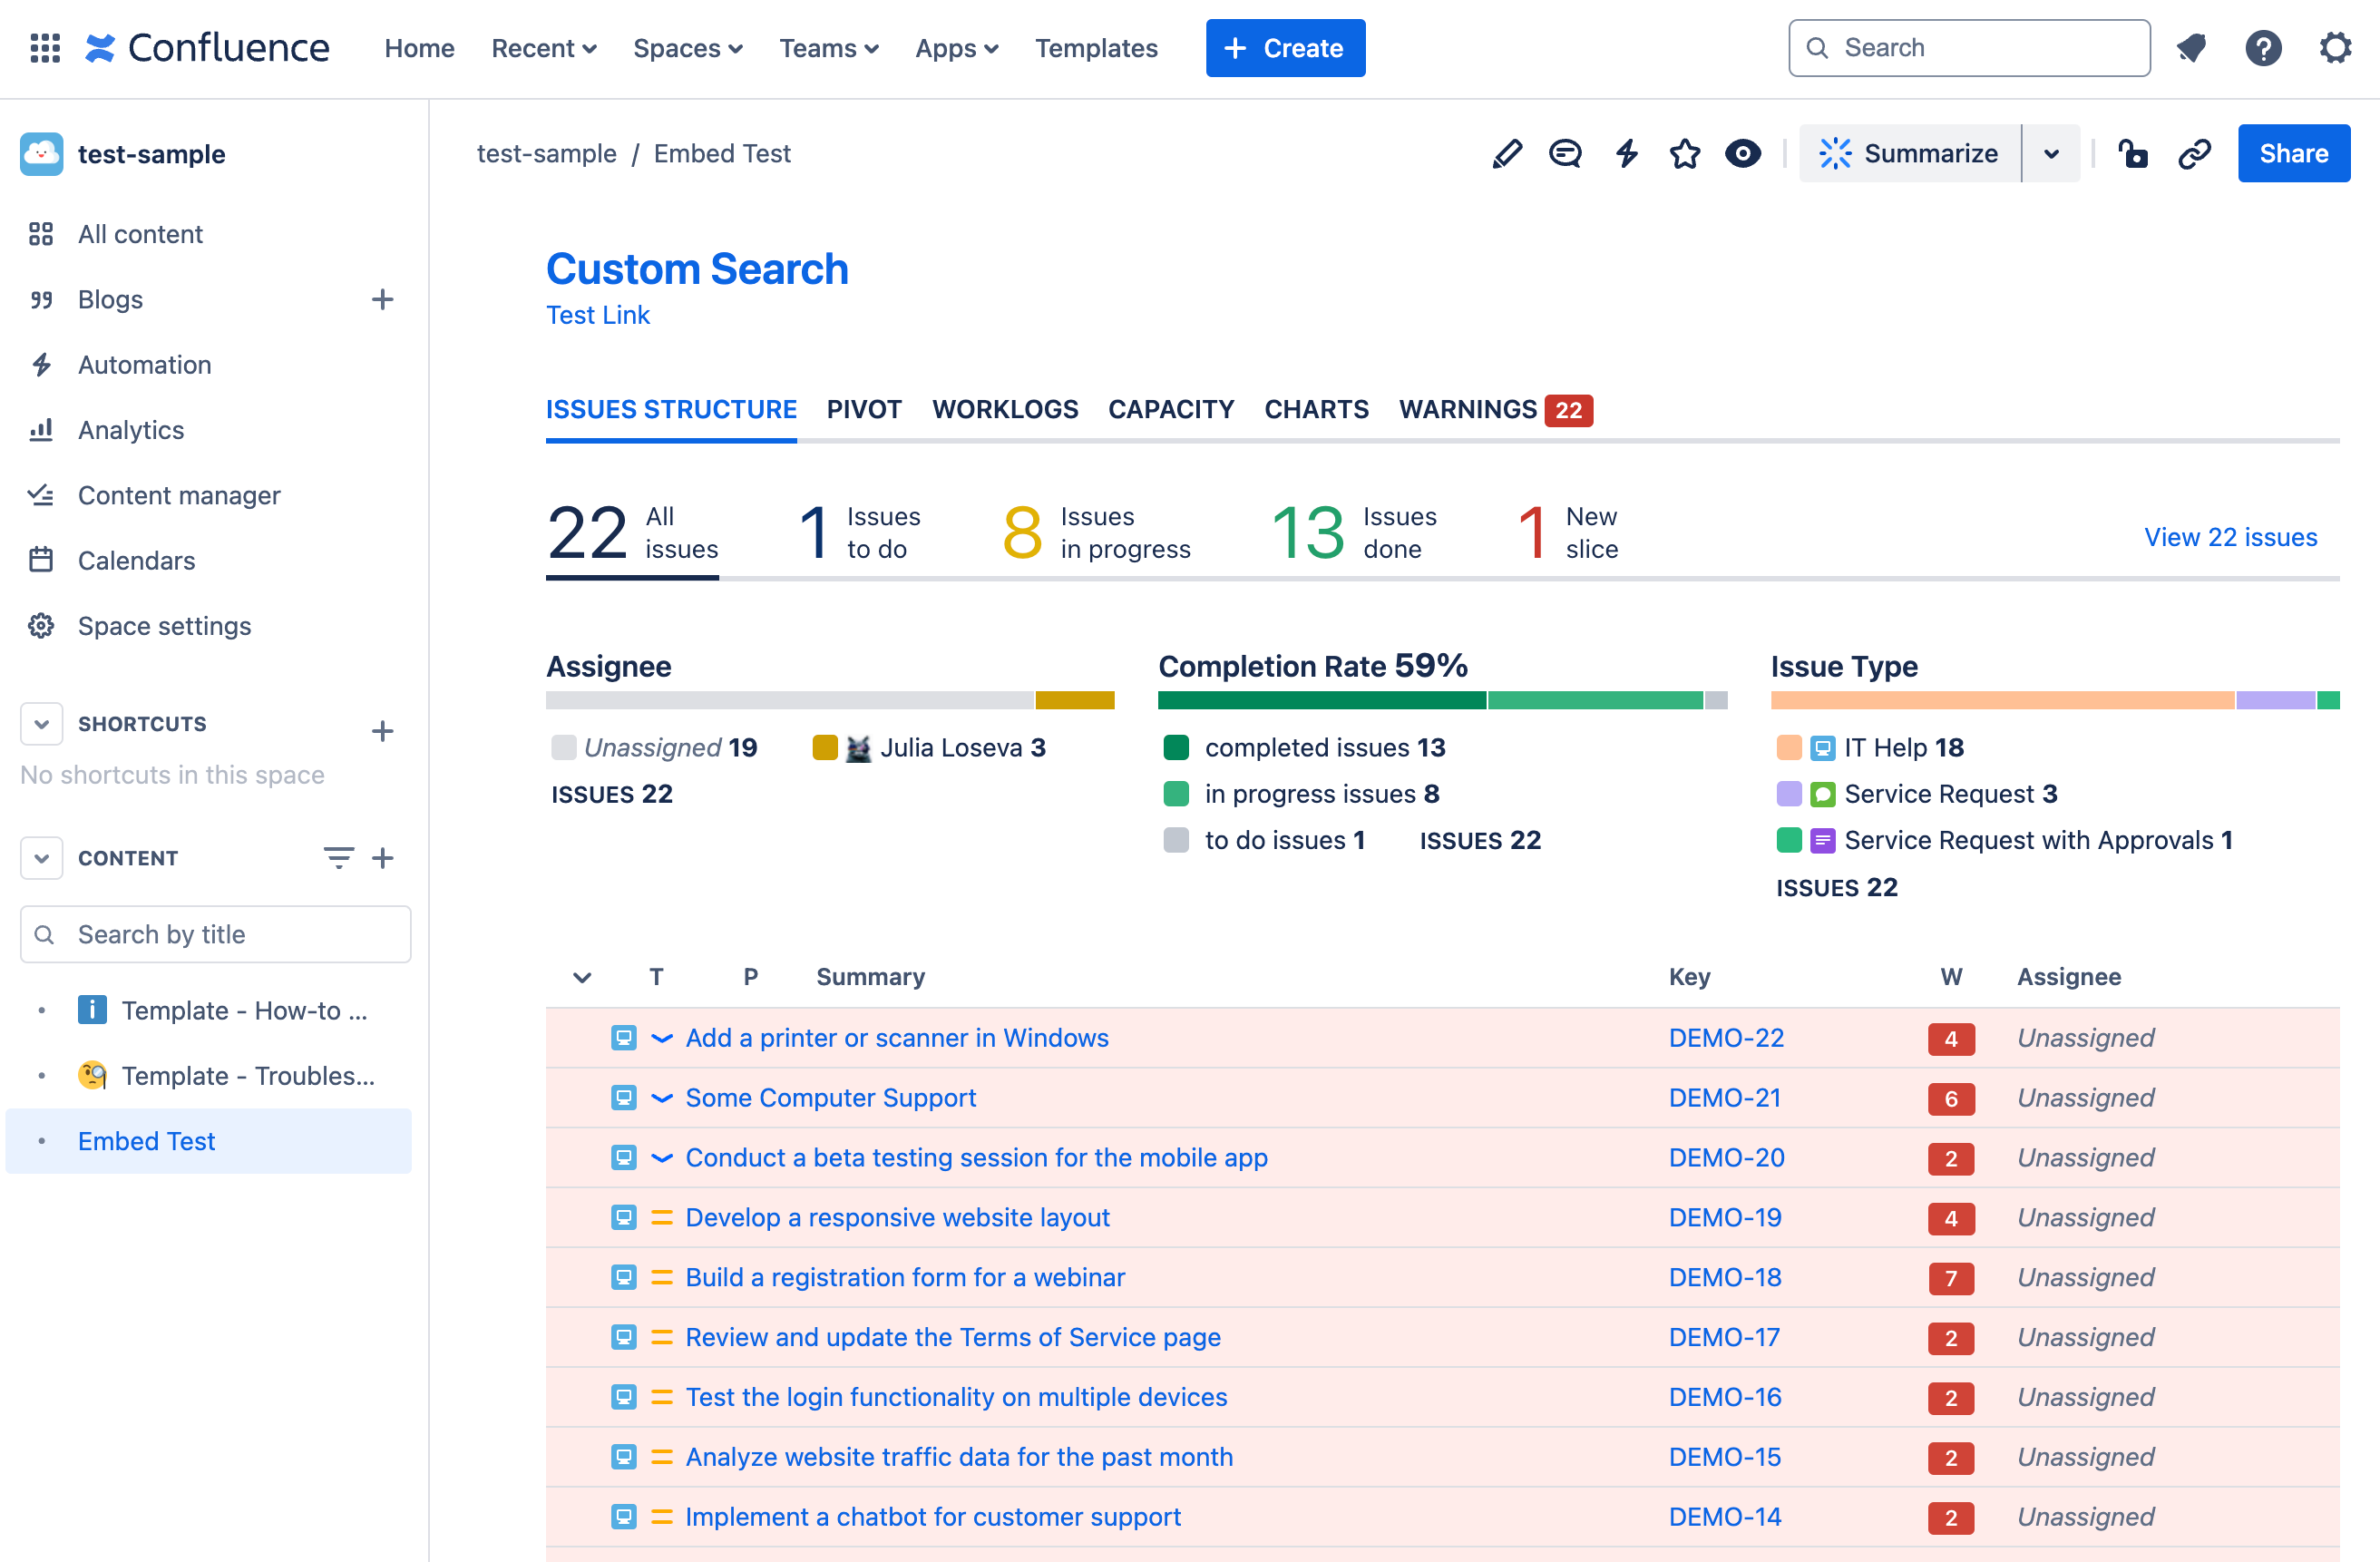
This enhancement means you can now seamlessly integrate your saved Pivot Reports into Confluence pages within Jira Cloud or any web page, providing greater flexibility and accessibility for your data.
This integration is designed to streamline your workflow, allowing you to keep all relevant information in one place, whether it’s for team collaboration or public sharing.
For detailed instructions on how to add a saved Pivot Report to a Confluence page, please refer to our guide.
This guide will walk you through the steps to embed your reports quickly and easily, ensuring you can make the most of this new feature.
Importing reporting settings from one report to another
As Pivot Report continues to evolve into a more professional and robust tool, we recognize that the time and effort spent on tweaking and customizing reports is both significant and rewarding. However, starting a report from scratch can create some friction, especially when aiming for a perfect fit for your specific needs.
To address this, we have introduced a new feature that allows you to import settings from previously saved reports. This feature is designed to streamline the report creation process by letting you carry over configurations from existing reports.
Users can choose to import specific settings such as tabs, slices, and warnings, or opt to import everything, providing maximum flexibility and efficiency.
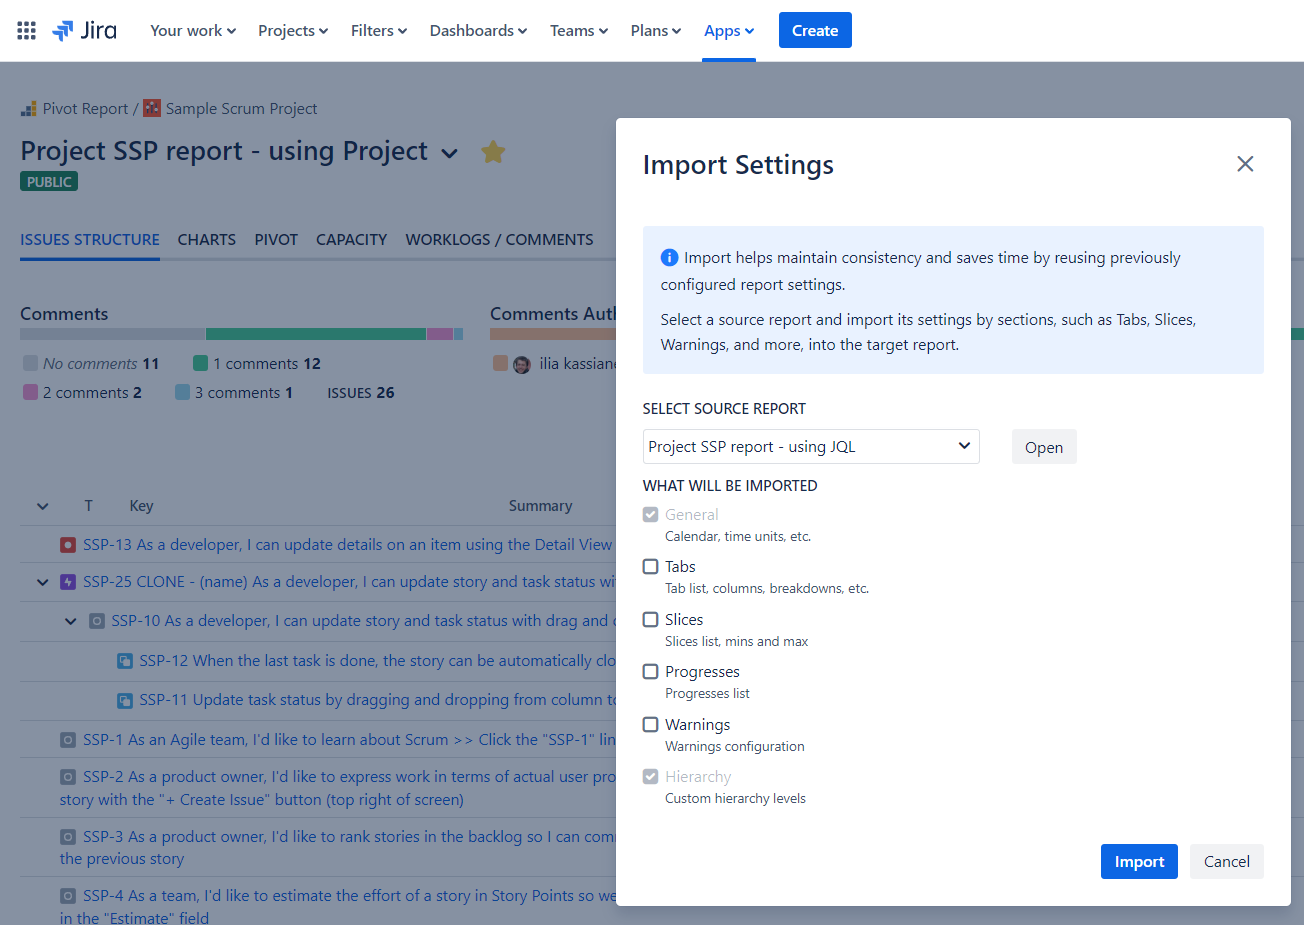
Importantly, this import feature will not affect the source of the report, including its name and description.
This ensures that you can replicate and modify report settings without altering your original reports, allowing for consistent and customized reporting across your projects.
Additional improvements
In addition to the major features introduced in this release, we’ve made several improvements to enhance the overall user experience and functionality of Pivot Report.
-
Arrows and Enter/Space Keys Support in Dropdowns with Search: Navigating dropdown menus (e.g. Values, Columns, Rows, etc.) has become more intuitive with support for arrow keys and Enter/Space keys, making the selection process smoother and more efficient.
-
Creating and Editing Reports Made Easier: We have simplified the process of creating and editing reports, making it more user-friendly and less time-consuming. These changes aim to reduce the learning curve and improve the overall efficiency of using Pivot Report.
-
Multiple Fixes and Improvements: As always, we’ve included various fixes and enhancements to improve the stability and performance of the app. These tweaks and adjustments ensure a more reliable and seamless experience for our users.
These additional improvements, while subtle, collectively contribute to a more polished and user-centric application, ensuring that your experience with Pivot Report is both productive and enjoyable.
Happy reporting everyone!