
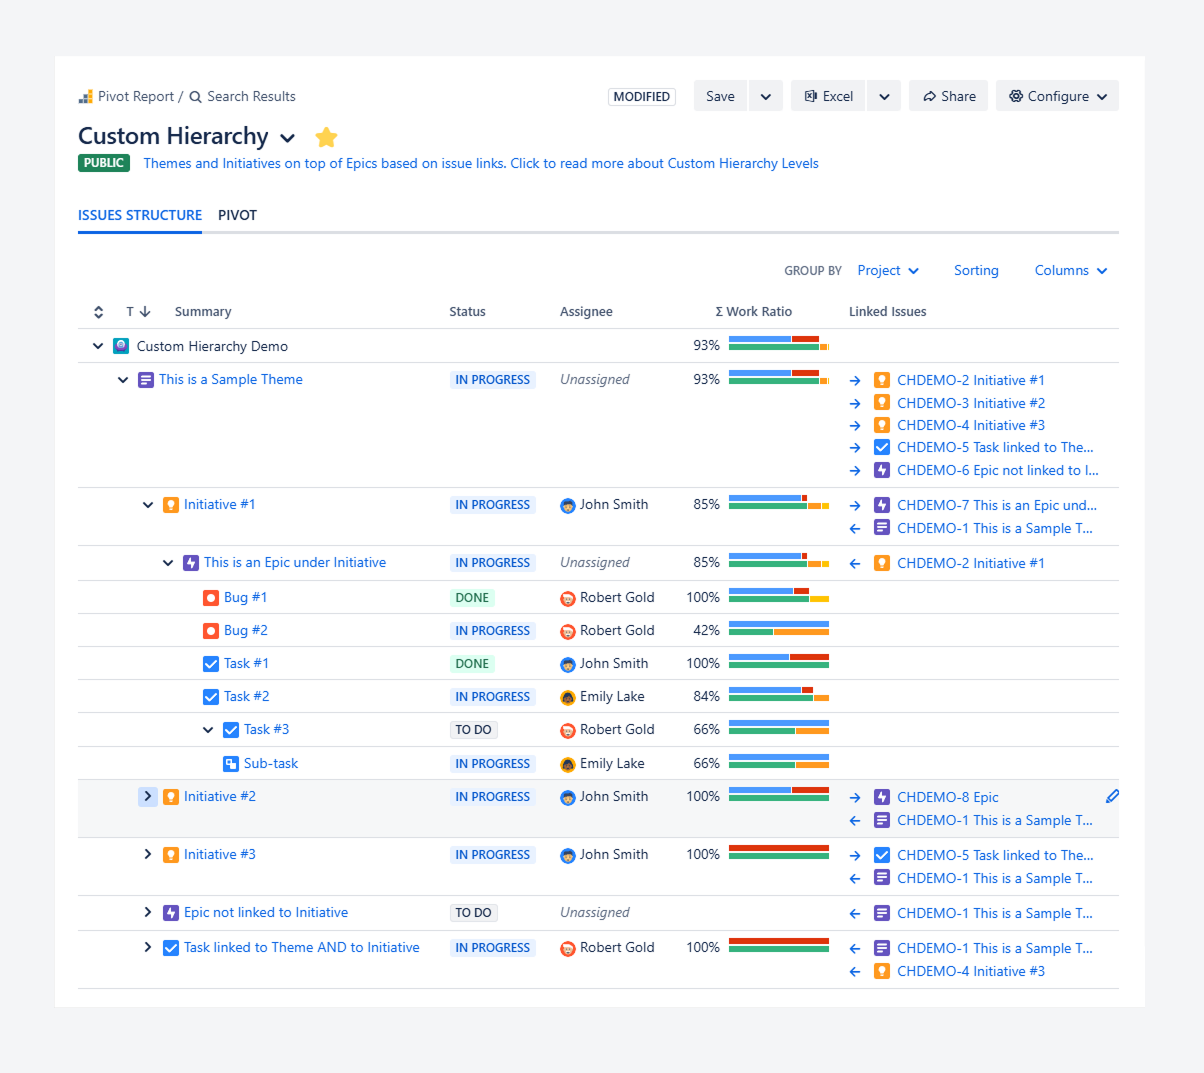
This article explains why and how to use the Work items Structure tab type within a report.
Why should you use this tab type?
The Work items Structure tab lets you display the full work item tree using either the default hierarchy (Epic → Story → Sub-task) or a custom hierarchy, without changing your Jira settings.
At each level of the tree, you can display rollup fields available in Jira’s Issue Navigator, along with additional report fields. These fields allow you to sort and filter the tree to quickly identify work items that require attention.
Overall, the Work items Structure tab acts as an enhanced version of Jira’s Issue Navigator. It builds on the same core features while adding detailed visibility into work item relationships, without needing to open the Work item view. This makes it easier to identify blockers directly within the tree.
Features and use cases
Display progress indicators as columns
Progress indicators, listed in a separate article, can be displayed as columns within the tab.
For example, Completion Rate can appear as a column. It is shown as a stacked bar that compares the number of Done work items with the total number of work items.
-20260205-065900.png?cb=c21d8e34aca54c53381a1f259adead44)
Displaying progress indicators as columns provides several advantages over Jira’s default views:
-20260106-043501.png?cb=53b1bacfd5c4ec480cc5bc90d907c581)
-
Jira’s Child work items section shows a completion rate based only on status and only for direct child items. It does not include sub-tasks. In comparison, in this tab you can display the completion rate for the work item as well as the entire tree.
-20260205-072020.png?cb=fa6460215538e51e3d0d3aa8ec09f8a8)
-
Jira’s Issue Navigator is limited to the Progress and ∑ Progress columns, which are based on time spent, remaining time, and original estimates. These same indicators can also be displayed as columns in this tab, alongside other progress indicators.
Display Linked or blocked items
-20260205-061355.png?cb=fa3edd6a145db7548f4ee7d4f9bcc7b9)
Linked work items, which appear in Jira’s Issue Navigator as shown in the screenshot above, can also be displayed within the Work items Structure tab.
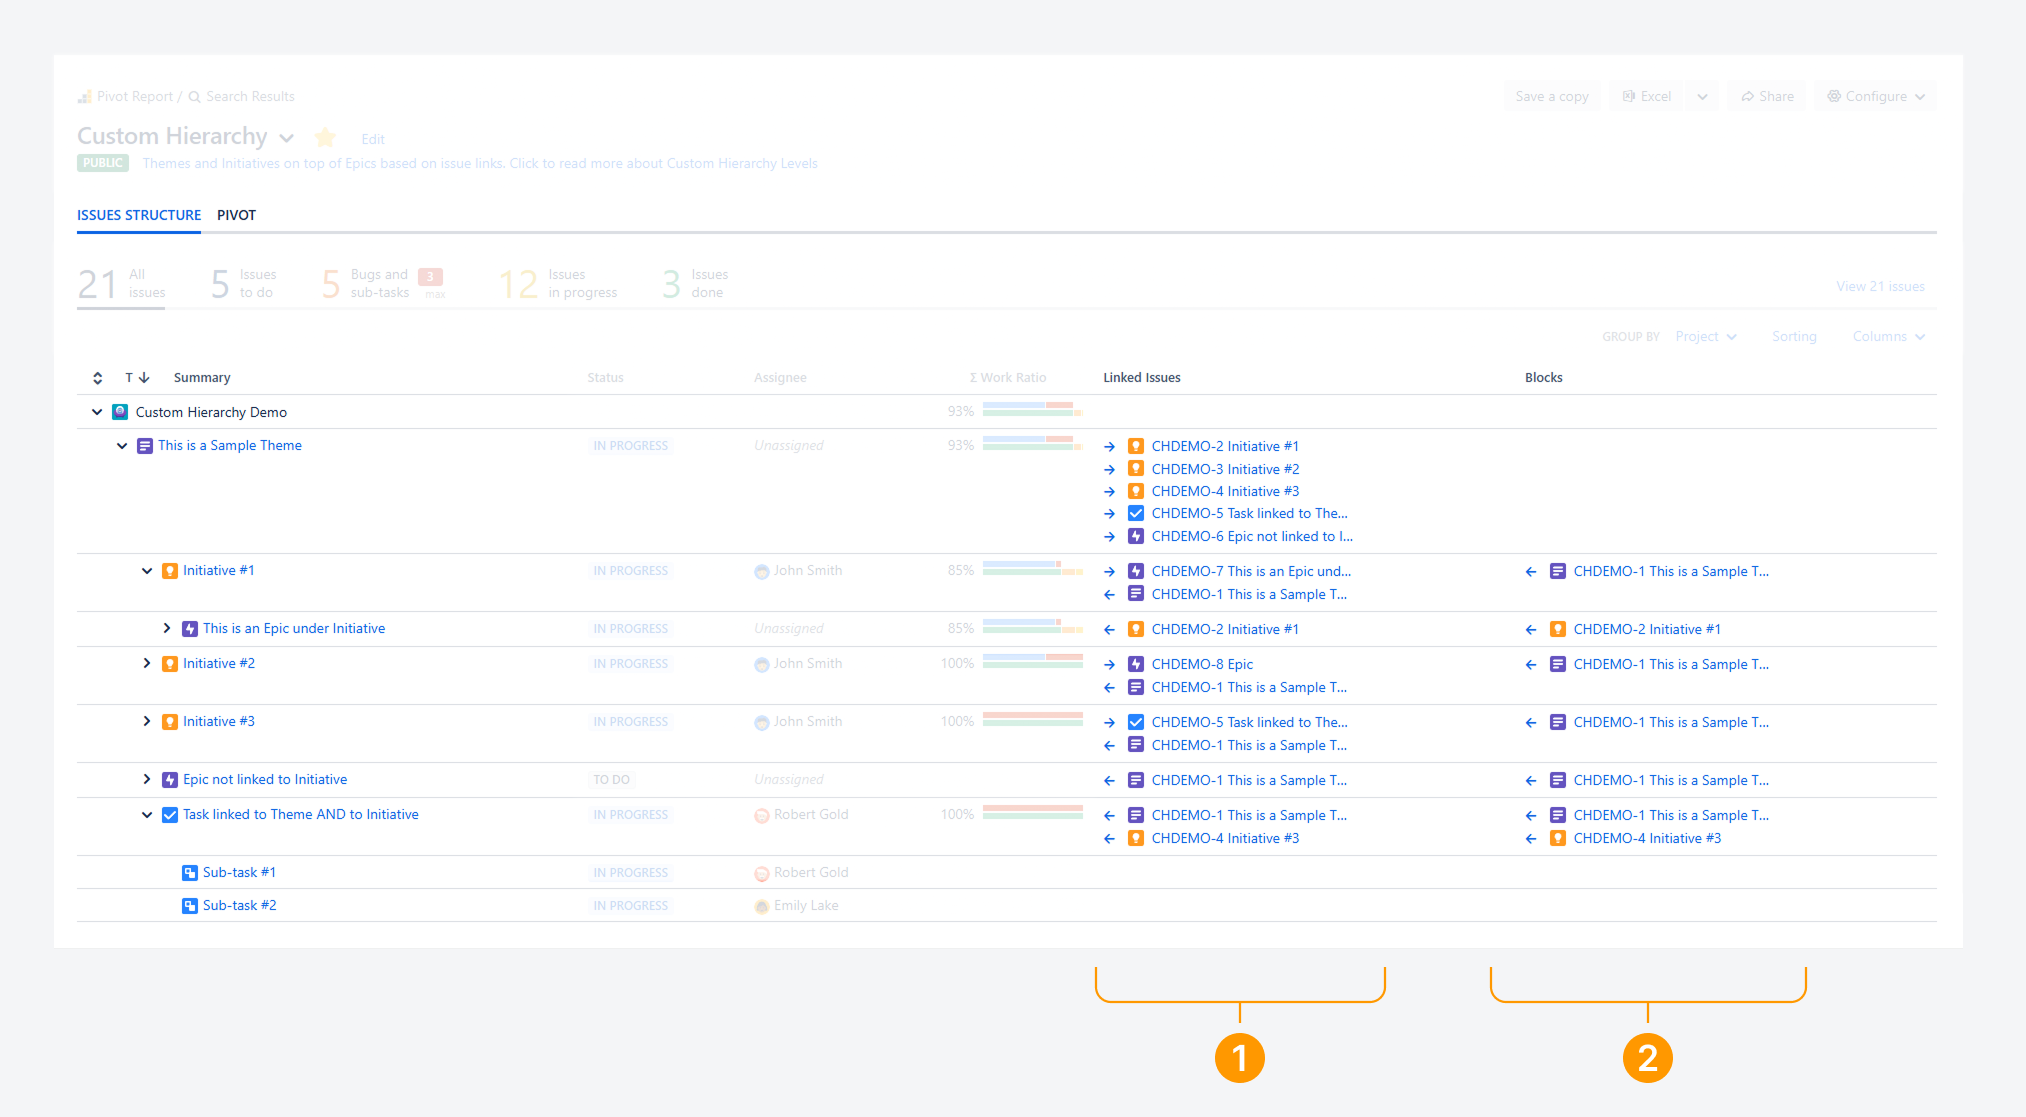
This tab provides several advantages over Jira’s Issue Navigator:
-
Linked work items appear alongside their icons, making it easy to see, for example, if an Epic is blocked by another Epic or by an Initiative that groups multiple Epics.
-
A separate column can be displayed for each relationship link type (Blocks, Is Blocked By, Relates To, etc.), allowing you to filter and identify relationships that may act as bottlenecks in your spaces.
In another scenario, a support ticket in one space may depend on a feature in another project. This dependency is visible in the Work items Structure tab tab without needing Jira Premium’s Advanced Roadmaps Dependencies view.
Sort Column sub-totals
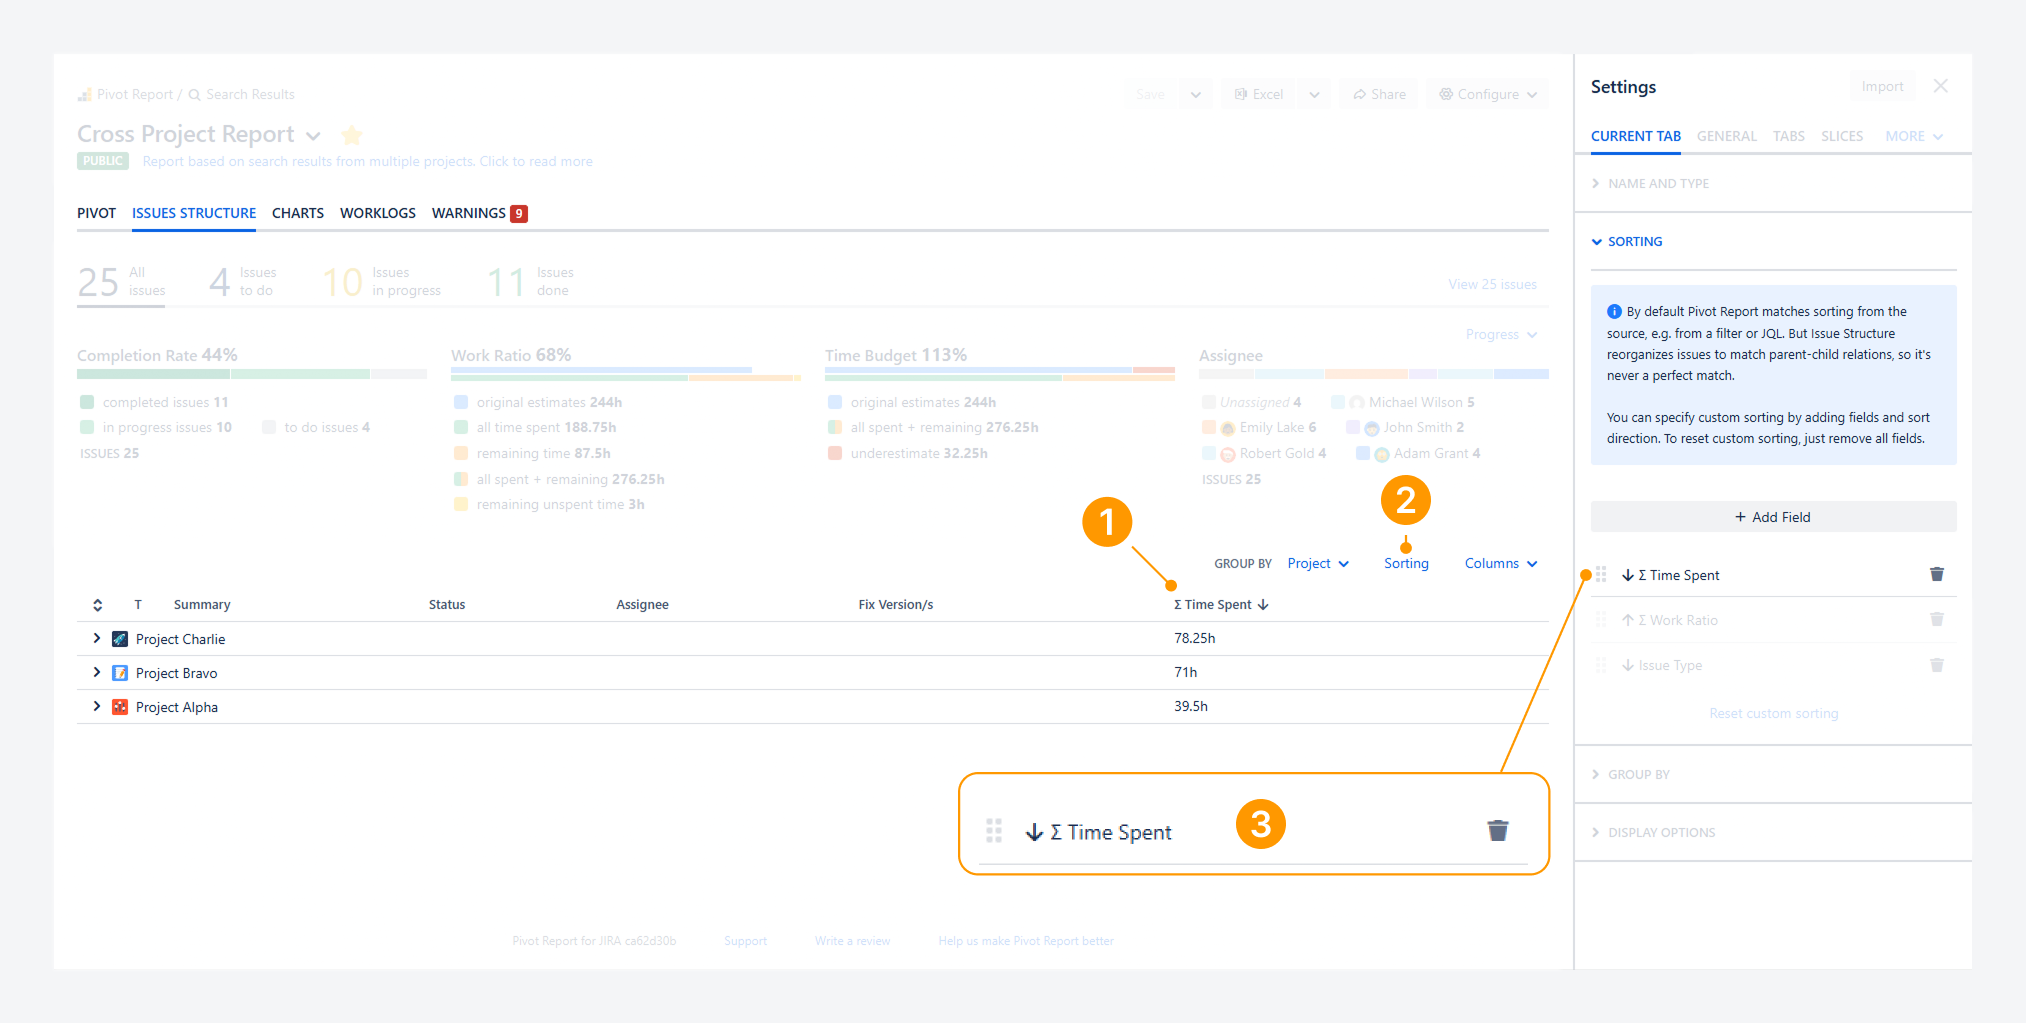
You can sort rollup column sub-totals, such as ∑ Time Spent, by following these steps.
-
Click the rollup column header. On the first click, the column values are sorted in ascending order, indicated by an upward arrow (↑). Click the header again to sort the values in descending order, indicated by a downward arrow (↓).
-
Alternatively, after clicking the rollup column header once, click Sorting.
-
Then select the field name and choose whether to sort it in ascending or descending order.
Sort rows using any field
You can sort rows using any field by following these steps, even if the field is not used in a Column.
-
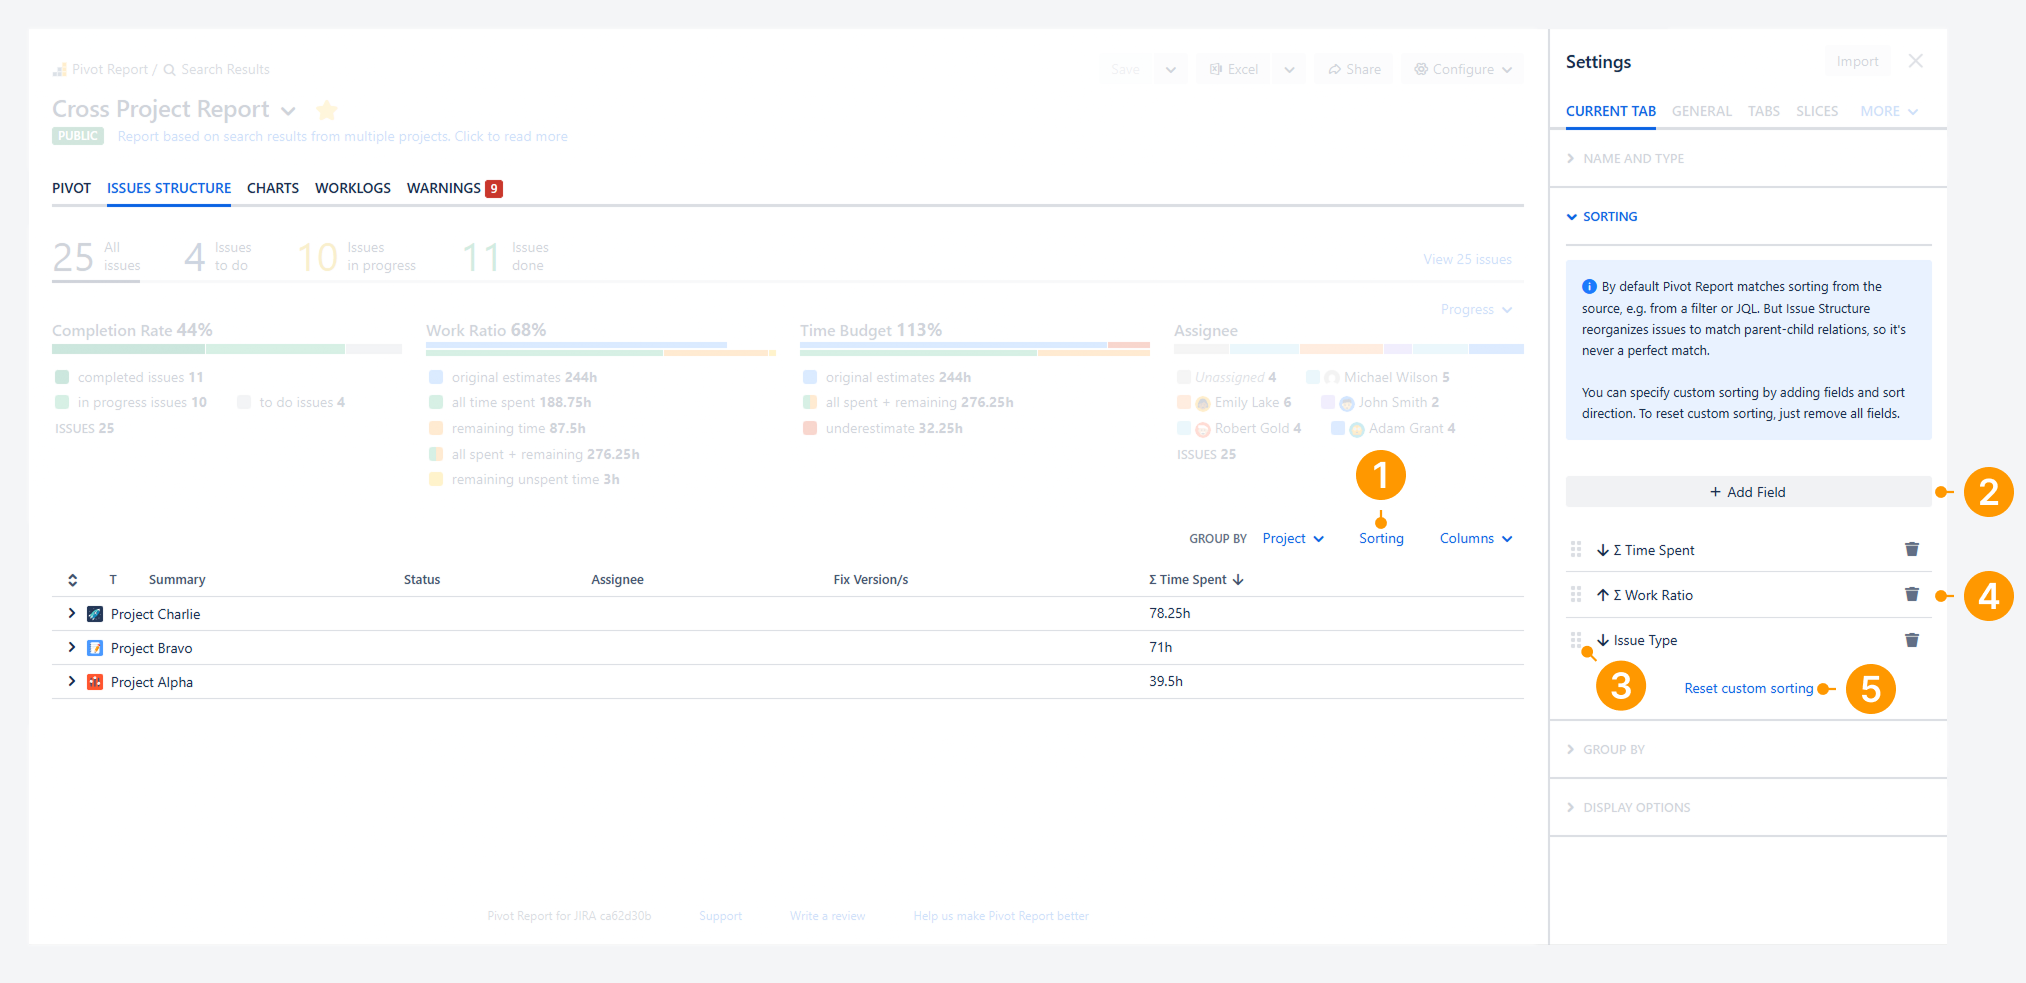
Click Sorting to open the report sidebar.
-
Click Add field, open the dropdown menu, and select the field you want to sort by, such as Work item Type. The field is added to the bottom of the sorting queue, and it is sorted in ascending order, indicated by an upward arrow (↑). You can use up to three fields at a time.
-
To change the sorting priority, drag a field using the grid icon (the dotted handle on the left side of the field card) to reposition it in the sorting queue. In the example shown, rows are sorted first by ∑ Time Spent, then by ∑ Work Ratio, and finally by Work item Type. To sort by Work item Type first, drag it above ∑ Time Spent. Finally, click on the field name and choose whether to sort it in ascending or descending order. In the provided example, Work item Type is ranked in descended order, indicated by a downward arrow (↓).
-
Alternatively, to remove a field from the sorting queue, click the bin icon on the field card. For example, you can remove ∑ Work Ratio and ∑ Time Spent to sort only by Work item Type.
-
Also, to clear all sorting rules at once, click Reset custom sorting, then click Add field to select Work item Type again.
FAQ
Where can you you see Column sub-totals?
-20260205-030735.png?cb=6a2143f4cd8d73a1a0fb92b4592668ef)
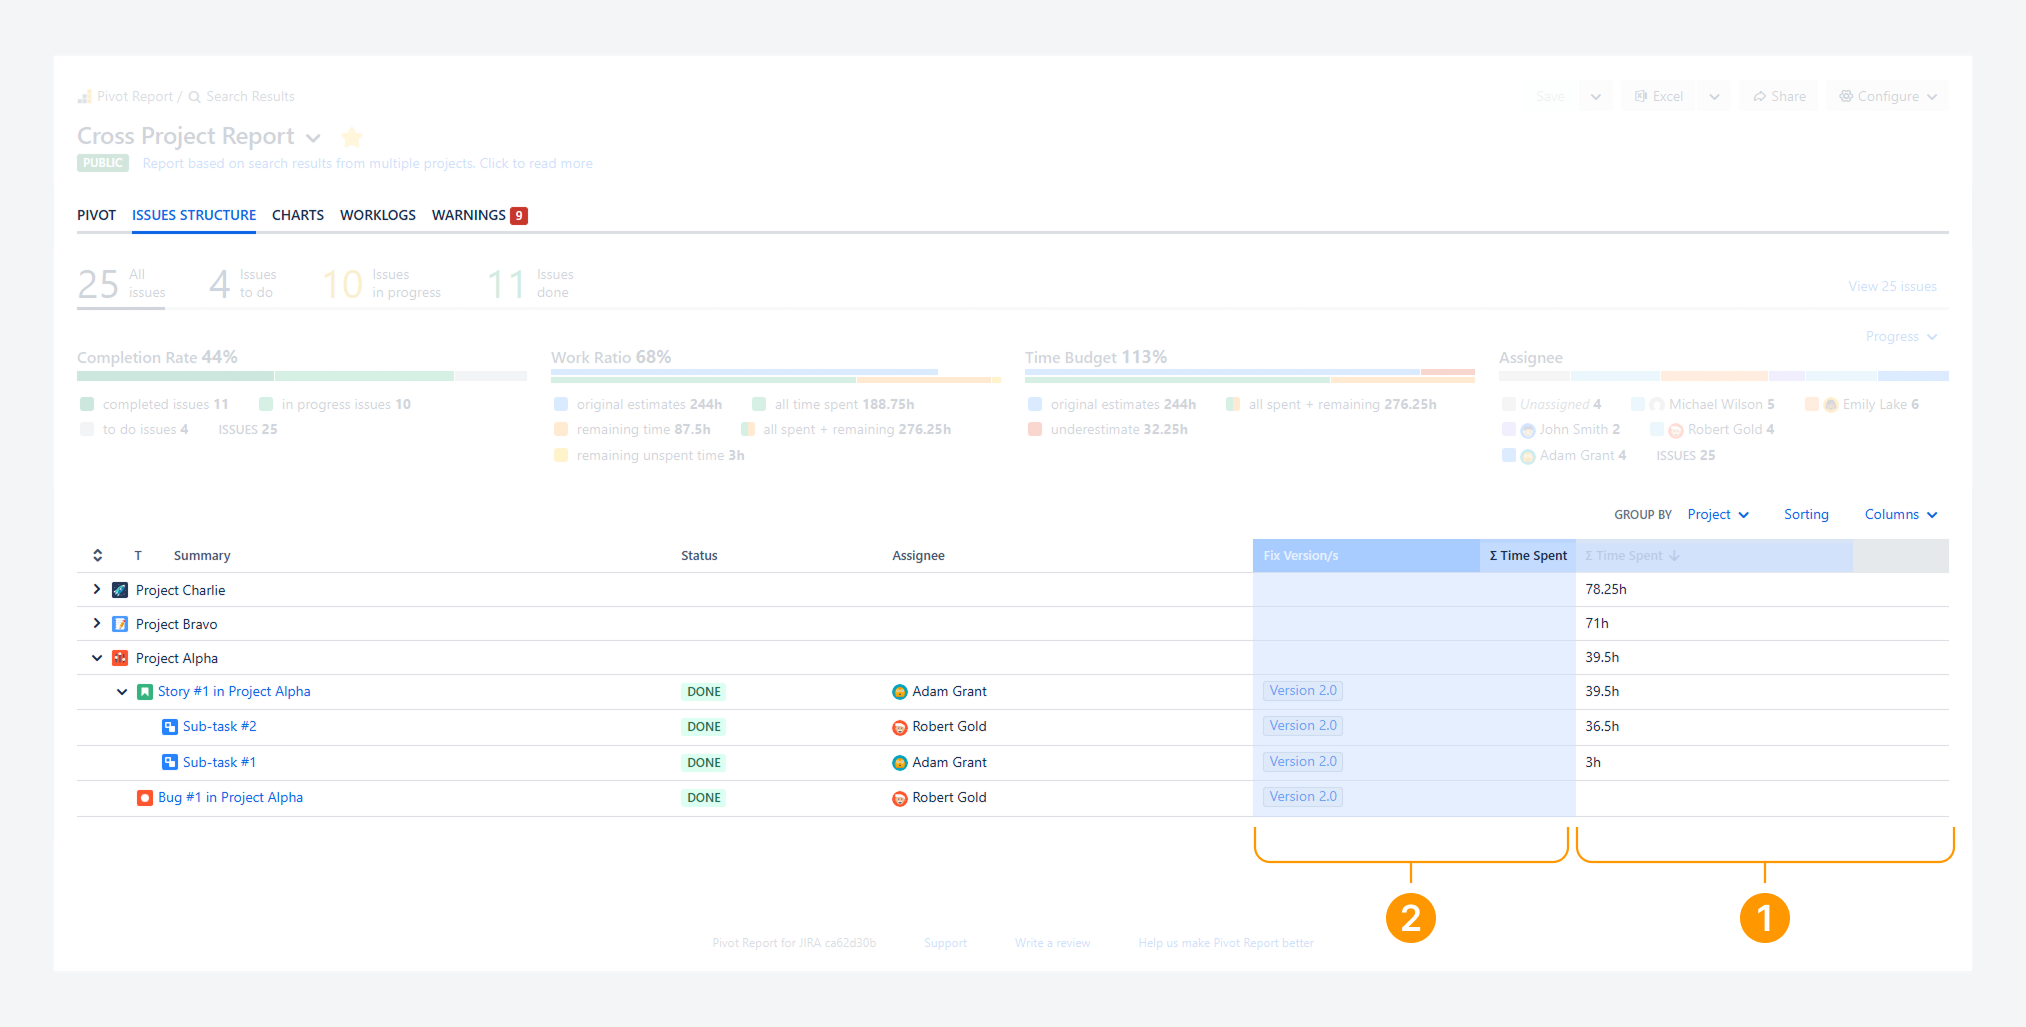
Column sub-totals appear at the top of the column, rather than at the bottom, as shown in the screenshot above.
-
The rollup column total for ∑ Time Spent across all work items in the space appears in the first row. In this example, rows are grouped by space.
-
A sub-total for ∑ Time Spent appears for each parent work item within the same group. In this example, sub-tasks are grouped under a story, and the story row displays the combined time spent for its sub-tasks.
-
The time spent for each individual sub-task appears in its corresponding row.
If you want to display the cumulative total for a rollup Column, such as ∑ Time spent, you will need to use either a progress indicator or a custom slice.
Can you change the order of Column appearance?
Yes. You can change the order in which columns appear by following these steps.
-
Select any part of the column header. In the example shown, ∑ Time Spent is the column being moved.
-
Drag the column to the desired position until a rectangle appears over the target column. In the example, ∑ Time Spent is moved to replace Fix Version.
Troubleshooting
This tab is missing. Where can you find it?
-20260316-231536.png?cb=1414f6cd8f62ce6d6872ffcac17a2e3c)
If the Work items Structure tab is missing, as shown in the screenshot above, it may have been removed from the report.
To add a tab, follow the steps in a separate article.
If you have questions or need assistance, contact our support team via email or service desk. Our team is available Monday through Friday (9:00 AM to 7:00 PM GMT+7) to help with technical challenges or discuss improvements.