
-20260218-062253.png?cb=74dcd07f92f85e2400eefa58a2c632d5)
This article explains why and how to use the Warnings tab type in a report.
It describes how warning types are enabled in the tab and then used across other sections of the report.
-
In the example above, several warning types are enabled in the Warnings tab.
-
In the Pivot tab, these warning types appear next to each flagged work item through the Warnings column.
You can test which warning types apply to your spaces in the available demo.
Why should you use the tab type?
The Warnings tab type lets you flag work items in a report using indicators commonly requested by project managers and scrum masters.
This helps highlight work items that need attention—such as overspent tasks or items with no remaining estimate—during an active sprint or sprint planning, supporting timely delivery.
Warnings are enabled per report. When a work item meets the criteria of any active warning, a red square icon appears in all tabs where Warnings are used, either as columns in the Breakdown section or as fields in the Summary section.
Which warning types are available to you?
The following warnings are available in the report. Several depend on the work item's status category (To Do, In Progress, or Done).
Time Tracking
-
Active work item with no remaining estimate: Flags work items in the To Do or In Progress status category that do not have a Remaining Estimate.
-
Overspent: Flags work items where Time Spent exceeds the Original Estimate.
-
Work item in progress with no estimate: Flags work items in the In Progress status category that do not have an Original Estimate.
-
Active work item with no estimate: Flags work items in the To Do or In Progress status category that do not have an Original Estimate.
-
Work item with logged time and no estimate: Flags work items that have logged time but no Original Estimate.
-
Completed work item with no time logged: Flags work items in the Done status category that have no logged time.
Status
-
Completed work item with active sub-tasks: Flags a parent work item set to Done while one or more sub-tasks remain in To Do or In Progress. This may indicate the parent was closed prematurely.
-
Active work item with completed sub-tasks: Flags a parent work item set to To Do or In Progress when all sub-tasks are Done. This may indicate the parent should also be closed.
-
Active work item in more than one sprint: Flags work items in To Do or In Progress that are assigned to a past sprint and possibly a current sprint. This suggests the issue was not marked as Done before the previous sprint closed.
Dates
-
No Due Date: Flagswork items that do not have a Due Date.
-
Overdue: Flags work items with a Due Date earlier than the current date.
Miscellaneous
-
No changes in the last two weeks: Flags work items in To Do or In Progress that have not been updated in any numeric, time-tracking, or text fields during the past two weeks. This applies whether the work item is linked to an active, future, or no sprint.
-
No changes in the last two weeks (excluding Backlog): Flags work items in To Do or In Progress that have not been updated in the past two weeks and are linked to an active or future sprint.
-
Unassigned: Flags work items without an Assignee.
Service Desk (Jira Service Management)
These warnings are available only for Jira Service Management (JSM) spaces. An SLA (Service Level Agreement) must be configured for them to apply.
-
SLA breached in the last or ongoing cycle: Flags SLAs breached in the most recent or current cycle.
-
SLA ever breached: Flags SLAs that have been breached at any time.
Features and use cases
Display Warnings as columns in the Breakdown section
Warnings can appear as columns in the Breakdown section of the Pivot, Worklogs/Comments, and Capacity tab types, as long as the Breakdown section is enabled and the Warnings column is shown.
-20260212-011218.png?cb=7175794c1e548a6604a35de15b6b3560)
Each work item associated with a warning is highlighted with a red tint. When you hover over the red square in the W (Warnings) column, a tooltip appears showing the specific warnings linked to that work item.
Display Warnings in the Summary section of the Pivot tab type
Warnings can appear in the Summary section of the Pivot tab type, as well as the Breakdown section.
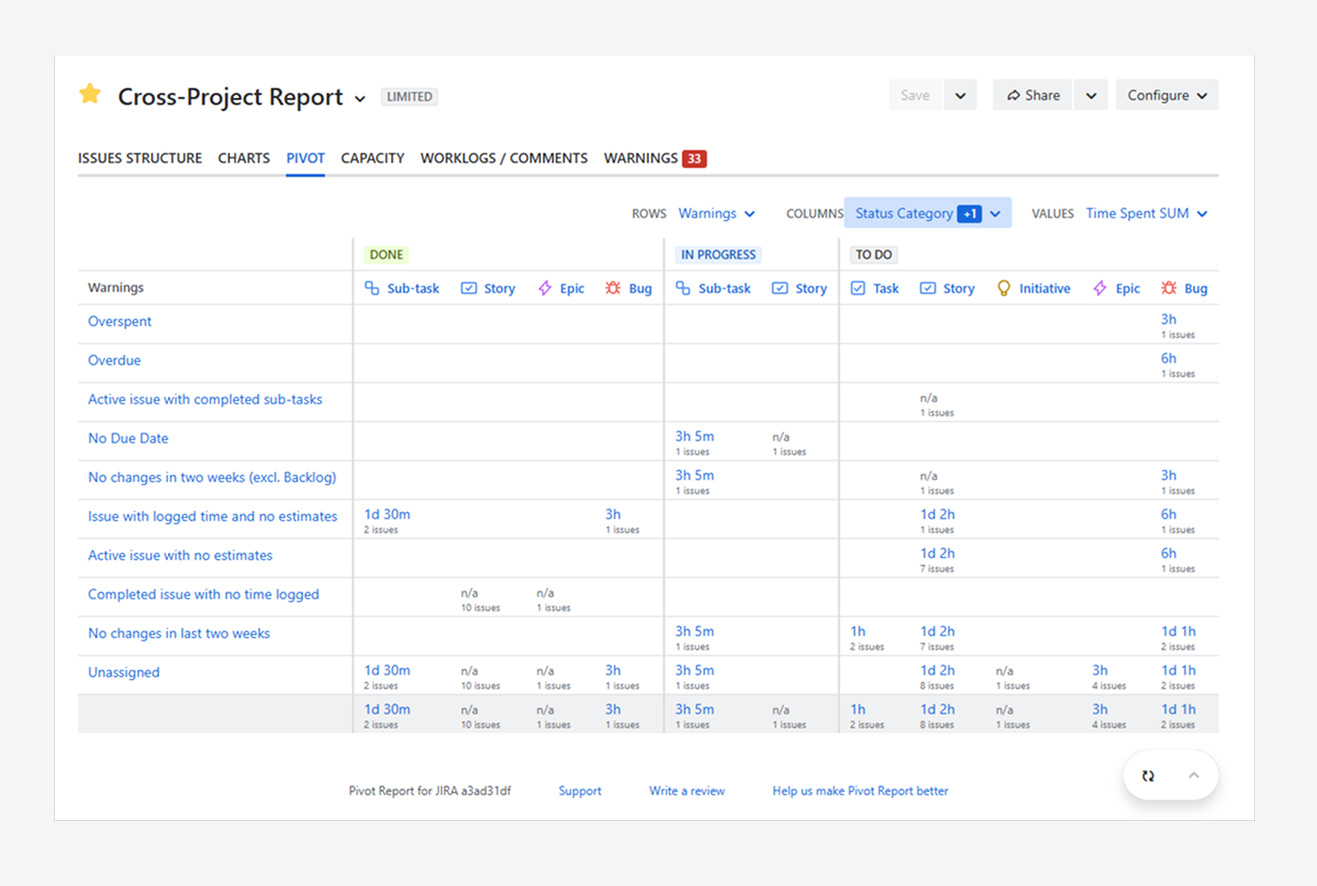
Each warning type can be visualized in a vertical bar chart and combined with additional columns for context, such as Work item Type, Status Category, or Time Spent for the work items associated with each warning.
In the example shown, the Work item Count column displays a vertical bar chart showing the number of work items linked to each warning. Clicking a bar opens a Breakdown pop-up that lists the work items related to that warning. Alternatively, you can use the Breakdown section below the table to see the work items related to that warning.
-20260302-035607.png?cb=45456c695e27712ce52113c6d60555c8)
This table view in the Summary section helps you focus on work items that have already started or have not yet begun. It allows you to address the root cause of a warning before more time is spent.
Display Warnings in the Summary section of the Worklogs/Comments tab
Warnings can appear in the Summary section of the Worklogs/Comments tab, as well as the Breakdown section.
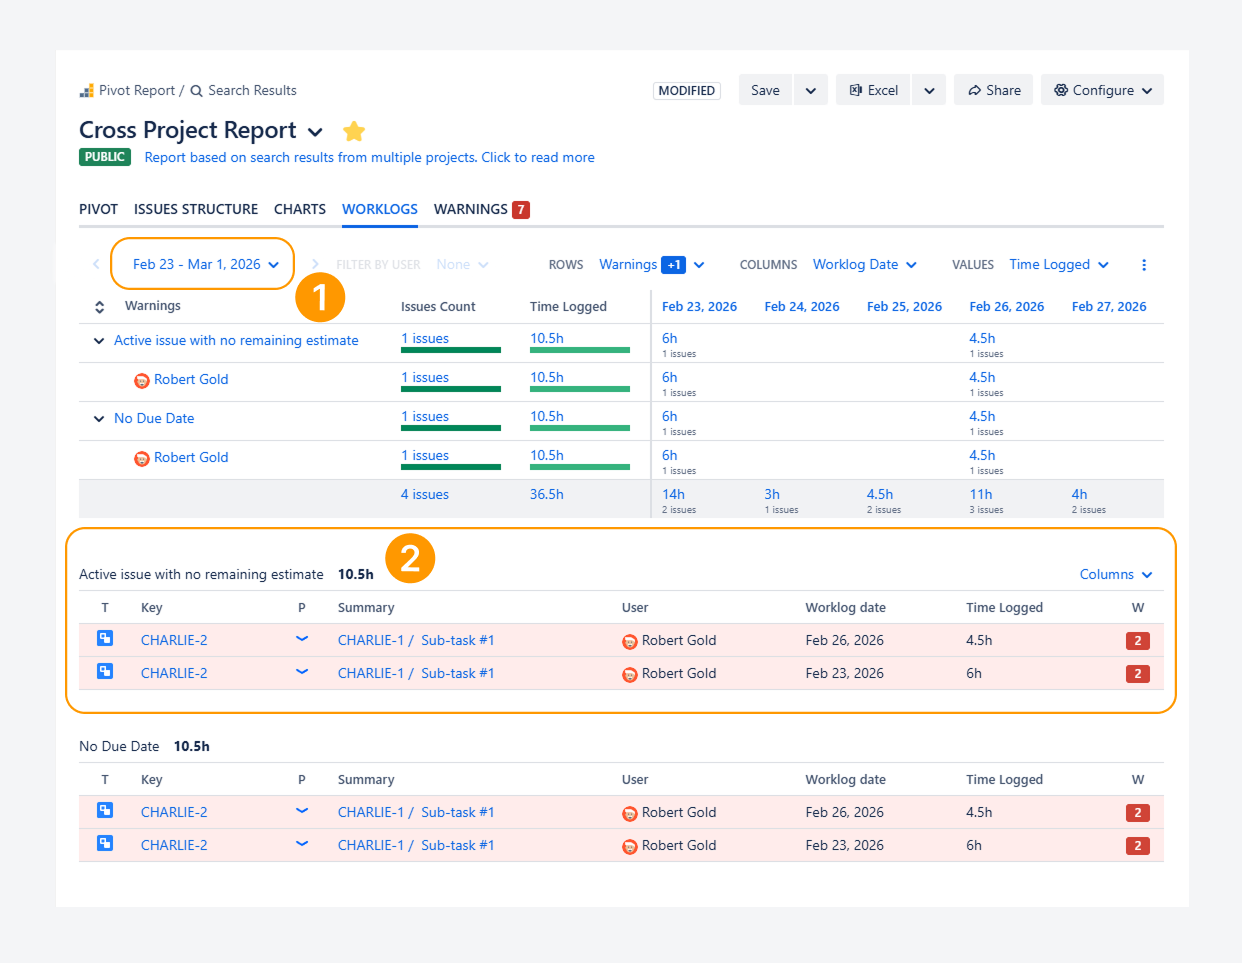
-
Within a selected time interval, you can filter work items flagged with warnings and identify which users logged time on those work items.
Keep in mind that the list of flagged work items may change depending on the selected interval (e.g. Feb 23 - Mar 1, 2026). For example, older completed work items may still carry an Overdue or other warning, even if you are reviewing recent worklogs.
-
In the example shown, fields such as Warnings, User, Worklog Date, and Time Logged help you analyze which users logged time on flagged work items during the last two weeks.
For example, the Active work item with no remaining estimate warning lists the relevant work items and the dates when time was logged. This helps you determine when the original estimate may have been exceeded—and evaluate the remaining effort as of the most recent worklog.
Display Warnings within the Charts tab type
Warnings can appear in the Charts tab type.
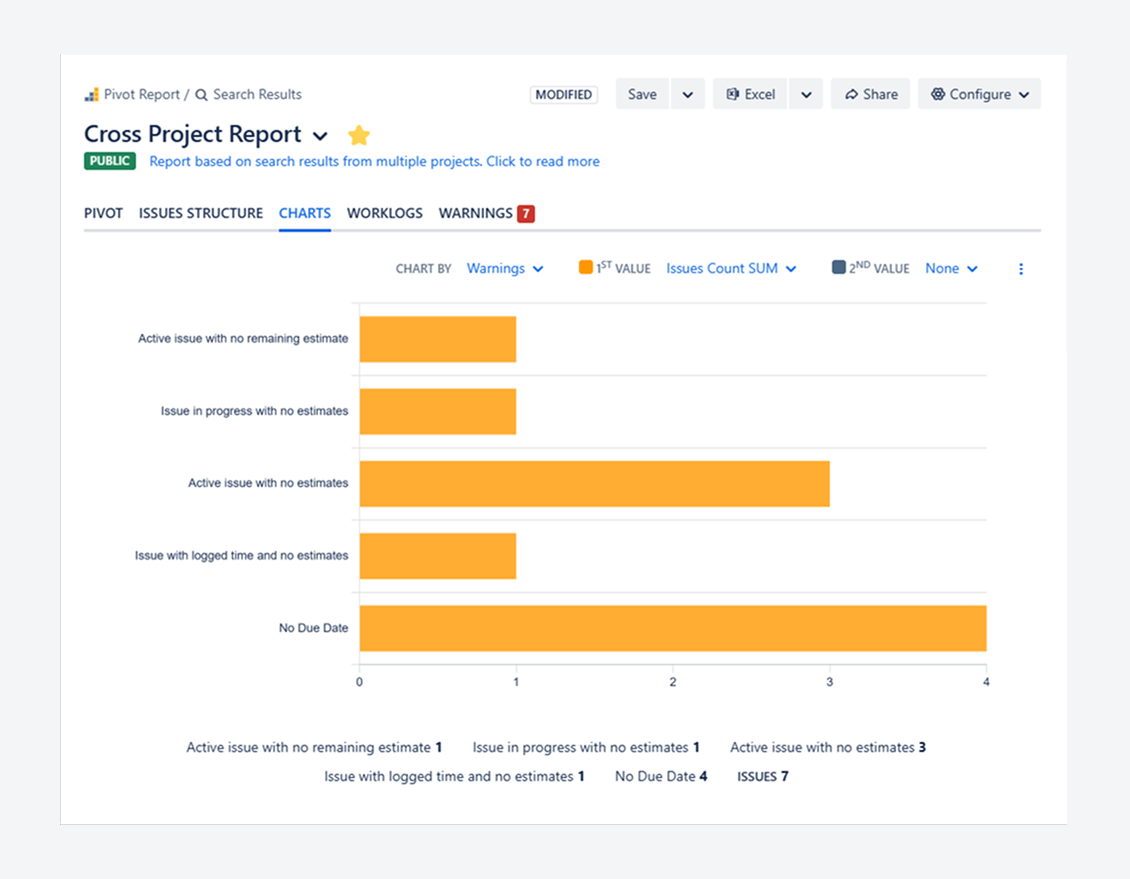
Each warning type can be visualized in a vertical bar chart. In the example shown, the Y-axis on the left lists the enabled warnings that contain values, while the X-axis shows the number of work items associated with each warning.
When you click a bar, a Breakdown pop-up appears, displaying the list of work items related to that warning. The pop-up below shows Active work items with no estimates.
-20260302-043159.png?cb=9566019b14444d66c42c67e385cf2554)
How can you enable warnings?
By default, all warnings activated for newly created reports. If you want to use all or specific warnings, following these steps.
-
Click Configure in the header section and select Warnings.
-
To enable all warnings, click Deselect All, then click Select All to enable every warning. (The Select All option appears only when no warnings are selected.)
-
To enable specific warnings only, in the Warnings options, click Deselect All, then select Warnings individually.
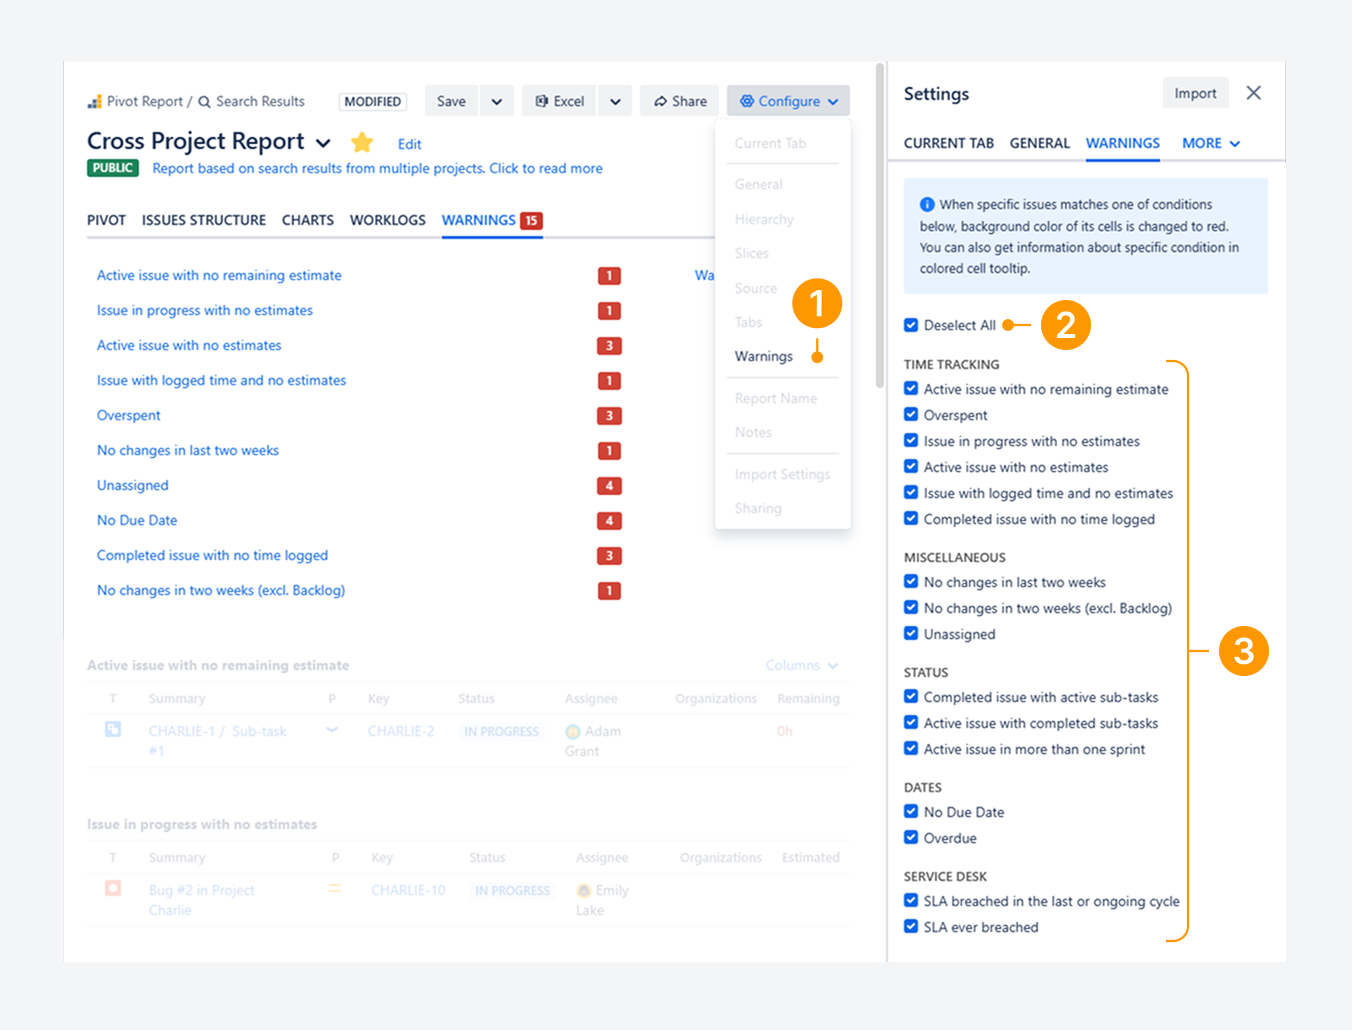
Alternatively, click Warnings in the Summary section of the Warnings tab, to access the options.
-20260302-044904.png?cb=6b35c36d3356fa28a531023ea182d5d8)
FAQ
Can an issue be flagged by multiple warning types?
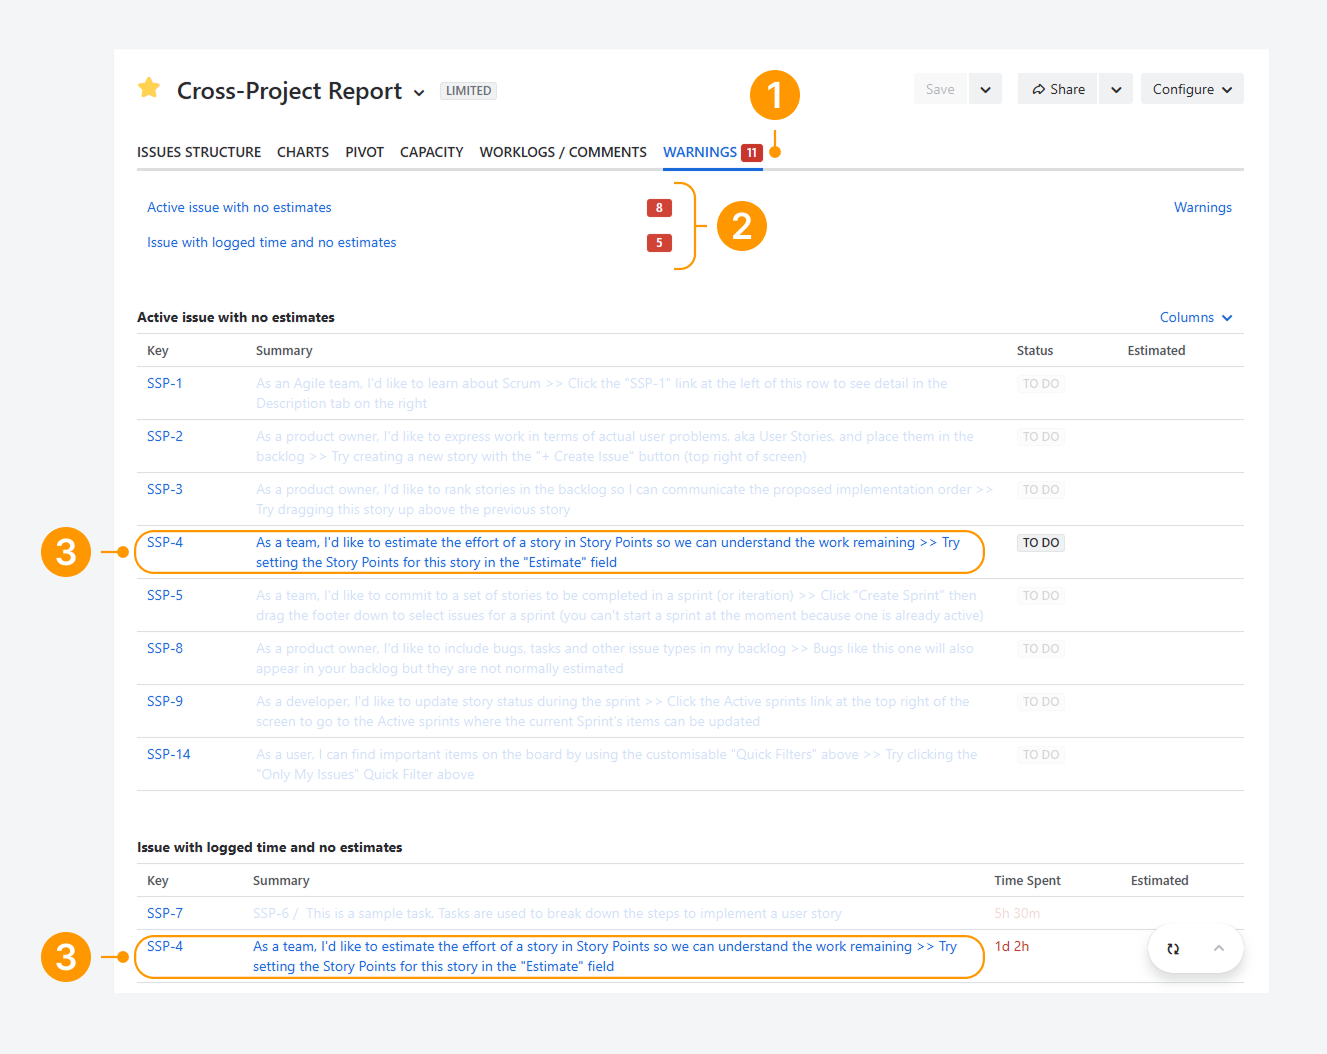
Yes. A work item can be flagged by one or more warning types.
-
Work items flagged by any enabled warnings are counted next to the tab name. In the example shown, 11 work items are flagged with at least one warning.
-
In the Summary section, the number of work items is displayed next to each warning type.
-
In the Breakdown section, work items are grouped by warning type. An issue flagged by multiple warnings appears under each relevant warning. For example, SSP-4 is flagged more than once and therefore appears under two warning types.
Personalized warning types
Time Zones
Can you show the Rollup value for Warnings in the Issue Structure tab?
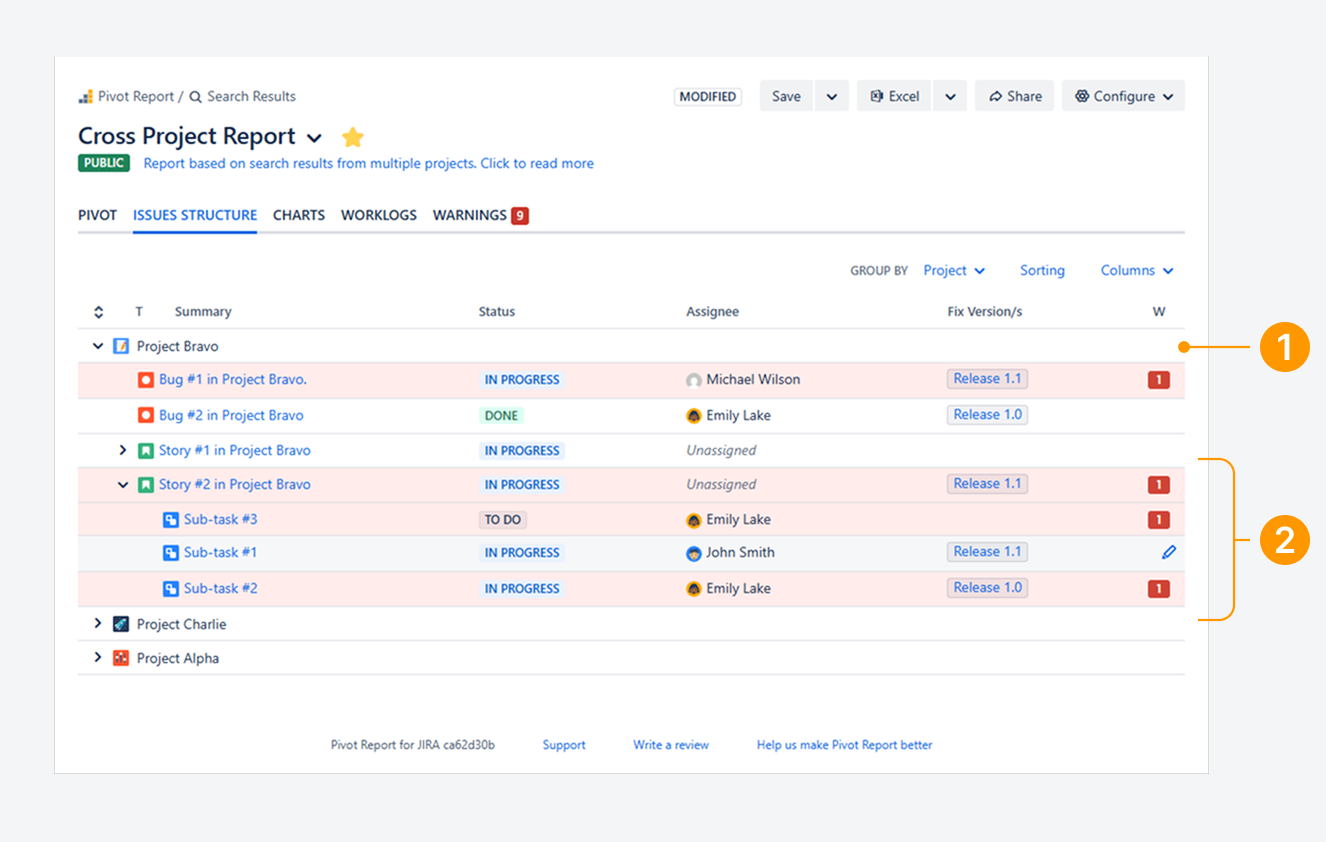
No. The Warnings column in the Work item Structure tab does not display rollup values within the hierarchy.
-
For example, rollup values do not appear for a Project or any other field used for grouping.
-
The number of warnings is shown for each flagged work item. Hovering over this number displays the list of warnings in a tooltip.
This behavior is consistent with the Breakdown sections in the Pivot, Worklogs/Comments, and Capacity tabs.
Breakdown section
Can you use the same columns in the Breakdown section for each Warning?
Each Warning comes with a predefined set of columns in the Breakdown section. To use additional columns, click Columns and select the fields from the dropdown.
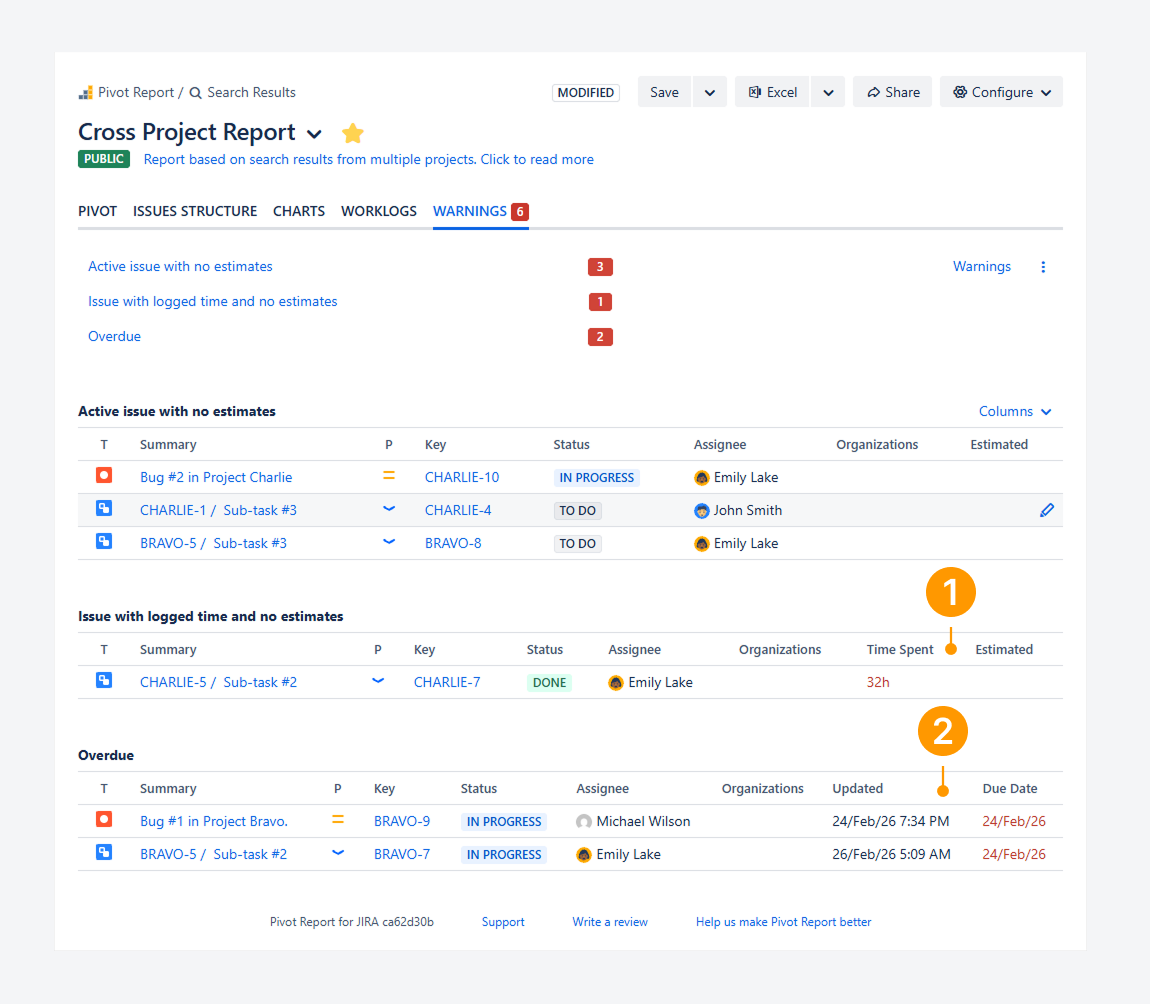
For example:
-
Time Spent and Original Estimate are shown together for the Work item with logged time and no estimates warning to highlight how much time exceeded the original estimate.
-
Updated Date and Due Date appear together for the Overdue warning to show when the work item was last updated compared with its due date.
To display these columns for other warnings, you must add them manually.
Can you rearrange columns within the Breakdown section of the Warnings tab?
Yes. You can rearrange columns in the Breakdown section from the report sidebar.
-
Drag a field using the grid icon (the dotted handle on the left side of the field card) to change its position.
-
For example, drag Key above Summary to place it before that column.
-20260218-043347.png?cb=c8d6b07891d2489dea5fed45bf7b614e)
Can you use the Breakdown section to display issues assigned to multiple sprints?
Yes. In the Breakdown section or the Work item Structure tab, the Sprints column shows how many sprints each work item has been assigned to.
This can serve as a warning indicator. As the number of sprint assignments increases for incomplete work items, the risk of delay rises. You can then compare Time Spent with the Original Estimate to determine whether the work item should be reassigned, re-evaluated, or descoped.
-20260305-040320.png?cb=f02b67f5e46a193ddffd2938a7e3bc53)
Troubleshooting
Warnings are enabled, however none appear. How you can verify if all warnings are enabled?
-20260226-043625.png?cb=f166261e96073ee4c15b37c9e48b485a)
When the Warnings tab shows OK next to its name in the Tabs section, or when the message Good job! No warnings found appears in the center of the screen, warnings are enabled. In this case, only the selected warnings are active, and none of them currently return results.
To verify whether all warnings—or only specific ones—are enabled in the report, follow these steps:
-
Click Warnings below the Good job! No warnings found message.
-
Alternatively, open the report sidebar and select Warnings from the available settings.
-
In the Warnings options, click Deselect All, then click Select All to enable every warning. (The Select All option appears only when no warnings are selected.)
-
To enable specific warnings only, select them individually instead of using Select All.
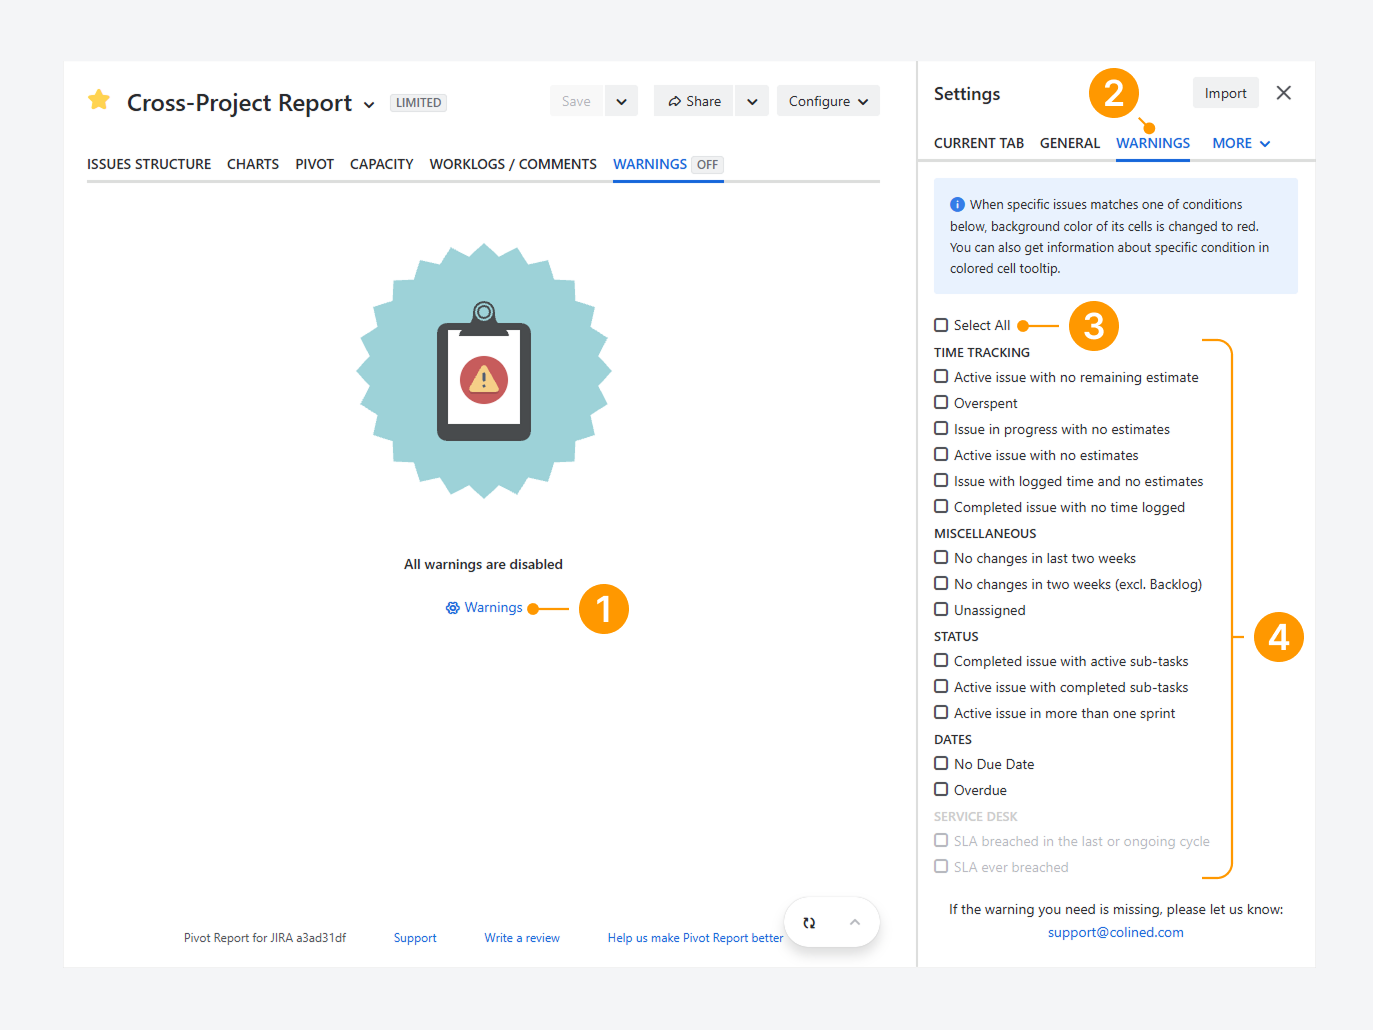
Warnings shown in grey are available only for Jira Service Management (JSM) spaces. For these warnings to apply, a Service Level Agreement (SLA) must be configured.
-20260226-044239.png?cb=986af3c4c844548b3402b310cb1a6590)
Warnings are not shown and appear disabled. How can you enabling them?
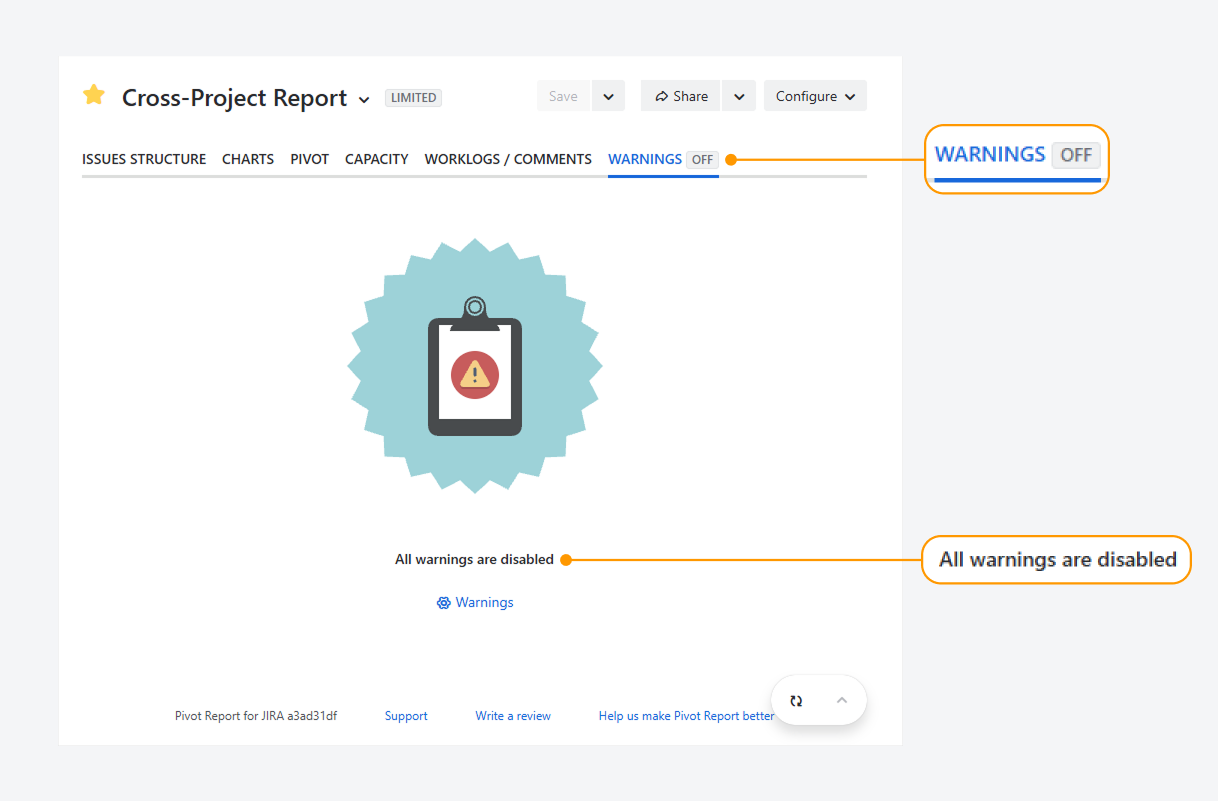
If warnings are not appearing, they may be disabled for the report, as shown in the screenshot above. When the Warnings tab displays Off next to its name in the Tabs section, or when the message All warnings are disabled appears in the center of the screen, warnings are turned off.
To enable warnings, follow these steps:
-
Click Warnings below the All warnings are disabled message.
-
Alternatively, open the report sidebar and select Warnings from the available settings.
-
In the Warnings options, click Select All to enable all warnings.
-
To enable only specific warnings, select them individually instead of clicking Select All.
Warnings shown in grey are available only for Jira Service Management (JSM) spaces. For these warnings to apply, a Service Level Agreement (SLA) must be configured.
This tab type is missing. Where can you find it?
-20260316-231536.png?cb=1414f6cd8f62ce6d6872ffcac17a2e3c)
If the Warnings tab is missing, as shown in the screenshot above, it may have been removed from the report.
To add a tab, follow the steps in a separate article.
If you have questions or need assistance, contact our support team via email or service desk. Our team is available Monday through Friday (9:00 AM to 7:00 PM GMT+7) to help with technical challenges or discuss improvements.