
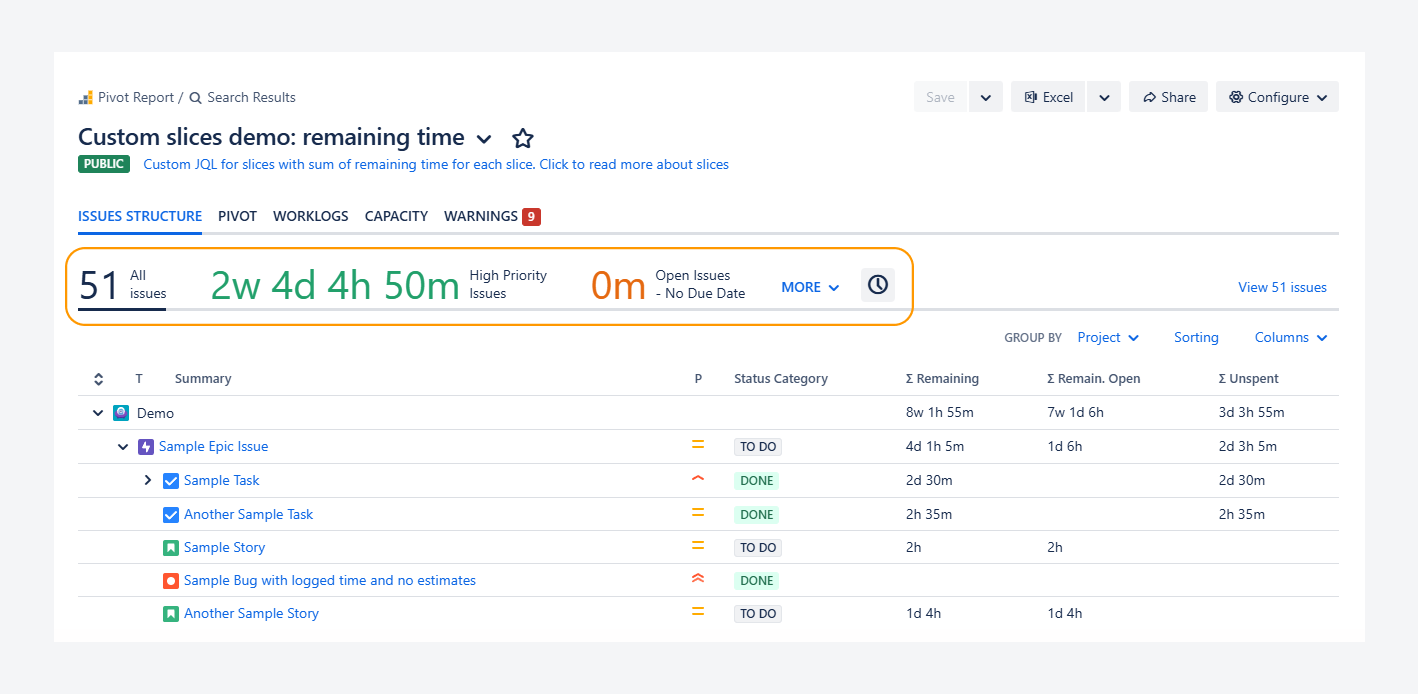
This article explains why and how to use slices in a report. It describes how slices created in the report sidebar help filter content across all tab types by selecting one slice at a time.
You can test which slices best fit your projects by using the available demo.
Why should you use Slices?
Slices act as filters that help you group report content and track progress, similar to a swimlanes and column constraints on boards. Unlike individual filters, multiple conditions can be combined into a single slice, and you can set maximum and minimum thresholds that trigger a warning when exceeded.
Slices also allow you to display different types of values for each group, including numerical values (issue count), time-based values (time remaining), relationship-based values (blocked issues). percentages, or fractions.
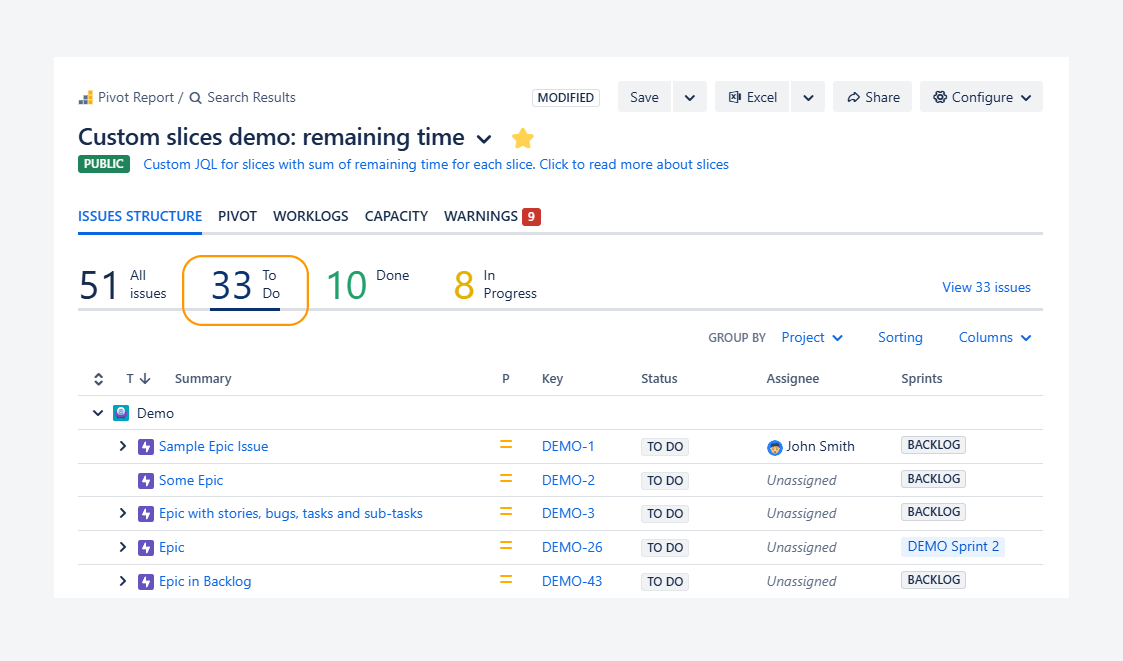
In the screenshot below, selecting the To Do slice groups 33 issues with that status category and displays them in the Summary and Breakdown sections across all tab types.
Features and use cases
Reuse swimlane queries to filter reports
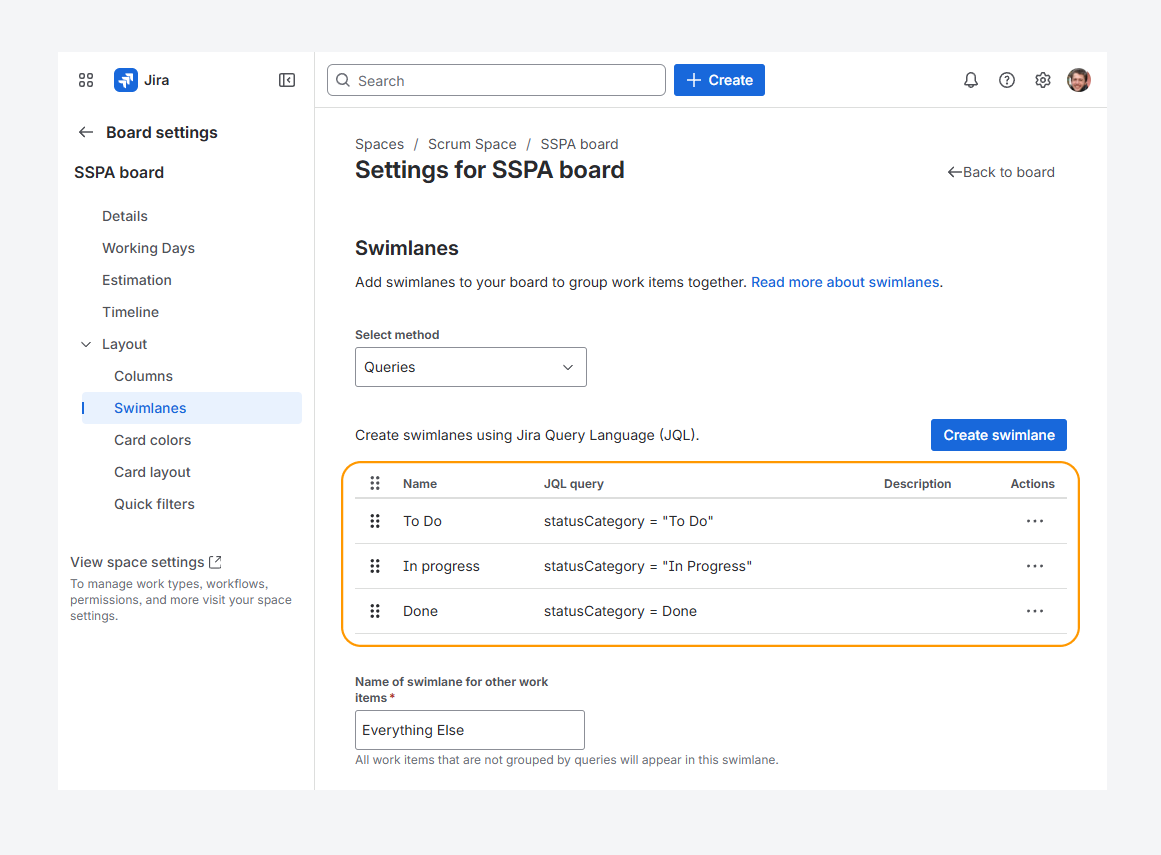
You can reuse the queries that group issues within a board’s swimlanes to filter a report. This lets you analyze one swimlane at a time without waiting for the entire board to load.
For example, swimlanes may be based on an issue's status category. You can reuse these queries in a report by adding them as custom slices.
To reuse swimlane queries:
-
Click Configure in the header.
-
Select Slices from the dropdown.
-
Open the Custom JQL slices section.
-
Paste the query from a swimlane (for example, Issues to do).
-20260506-224423.png?cb=f4a24607786dcd2daa051388b90061a4)
-
Optionally, in the Custom JQL slices section, enable Hide All Issues slice.
This prevents the report from displaying the full board content in the All Issues slice. Only the custom slices based on your swimlane queries will appear.
-20260506-225124.png?cb=7d055d36d328e744d28007b48a46d2d5)
You are not limited to JQL queries. You can also create slices using other swimlane options in Jira, such as:
-
Assignee
-
Epics
-
Spaces
For example, to use Assignee as a slice:
-
Click Configure in the header.
-
Select Slices from the dropdown.
-
Open the Slice By section, select Assignee.
-20260506-231922.png?cb=f9a60c6e8946e7b50084d2e409774744)
Display any value and display format in a slice
Within slices, you can display different types of values for each group—not just the number of issues in each status category—such as:
Time-based values
-20260401-215610.png?cb=4fd78c17afc2cb3dbb56bee5f61ccb74)
Slices can display time-based values. In the example below, Remaining Estimate is shown in slices that are customized with JQL to filter by priority, status, and issue type.
Relationship-based values
-20260401-220226.png?cb=d4e26cb147676fb7e1ef77422f62240c)
Slices can display relationship links, such as Blocked By, alongside the name of the issue being blocked. When you select a slice with this link, the report shows the issues that are blocking the issue named in the slice.
Fractions or rates
-20260401-222130.png?cb=c98e06ff98371e72ac086489fc018411)
Slices can display fractions or rates. In the example below, 36 story points are distributed across four assignees. One assignee has no story points assigned, so n/a appears in the slice, and 1 point remains unassigned. Each slice shows the assignee and the fraction of points assigned relative to the total.
When you select a slice for an assignee, such as Adam Grant, the report displays all issues assigned to them. Note that for the selected slice in the screenshot, issues include only the points directly assigned to Adam (2 story points), regardless of any points associated with a parent issue assigned to another assignee, such as Emily Lake.
Percentages
-20260401-223540.png?cb=879b41d73621cc8d59865f14d79d0a12)
Slices can display percentages. In the example below, 51 issues are grouped across three releases. Approximately 71% of the issues have no fix version assigned, 8% (about 4 out of 51 issues) are assigned to Version 1.1, 10% to Version 1.0, and 12% to Version 2.0. Each slice shows the release name and the percentage of issues assigned to that fix version relative to the total.
If an issue is assigned to multiple releases, the cumulative percentage of the slices may exceed 100%, as the issue will appear in multiple slices.
When you select a slice for a release, such as Version 1.1, the report displays four issues assigned to it. Parent issues will appear regardless of which release they are assigned to, but they are not included in the percentage calculation.
Define min/max values that trigger a warning
You can establish minimum and maximum values for a custom slice to show a warning when limits are surpassed, much like the constraints on board columns shown in the screenshot.
-20260404-000854.png?cb=d223de19e880b704a519df94d46e7a9a)
In the example below, the Open Bugs slice contains 9 issues. Since the maximum value is set to 5, a warning appears next to the slice—regardless of the value displayed (such as Remaining Estimate) or the display format.
-20260403-215548.png?cb=29bc565aa40cd009452bcfcb7ac6b97c)
To define a threshold for a slice:
-
Click Configure in the header.
-
Select Slices from the dropdown.
-
In the Custom JQL slices section, select a slice (for example, Open Bugs).
-
Enter a value in the Max (Maximum) field. If the number of issues exceeds this value, a warning is displayed. If a field is left empty (for example, Min), no warning is triggered for that condition.
-20260403-232123.png?cb=c158ef66326a4f44fcca8c46e9f73edc)
-
Click Save in the header.
Once you set a minimum or maximum value, it does not need to be updated. A warning will appear automatically whenever the threshold is crossed as issue counts change over time.
In comparison, Jira board settings can also trigger warnings when column constraints are exceeded. For example, in an active sprint, a warning appears in the To Do column when the number of issues (14) exceeds the maximum limit of 5.
Board status columns can only display issue counts, whereas slices can display other values—such as Remaining Estimate—while still showing a warning.
-20260403-235130.png?cb=113ba44ebe2ab25a449adc5fb32e2e59)
Use slices to filter progress indicators
When you need personalized indicators, slices can be used to filter the contents of your progress indicators. Here are examples for not using and using slices are filters.
Slices impacting indicators
Slices are also helpful in project reports where each slice represents a version. When you select a version, you can see the amount of work completed for it through numerical and time-based indicators.
Slices not impacting indicators
In a report that focuses on team performance, each slice may represent an assignee. In this setup, slices can appear below the progress indicators. When you select an assignee, the indicators do not change. Only the Summary and Breakdown sections update.
This approach works well when issues are reassigned within the same team or when several members log time on an issue owned by one assignee. In these situations, team-level metrics, such as total time spent or progress toward completion, often give a clearer picture than individual metrics.
To configure whether slices filter progress indicators within a report follow these steps:
-
Click Configure in the header section.
-
Select General in the dropdown.
-
Click Misc, and select whether to use default app setting or modify how slices affect progress indicators.
-20260325-222346.png?cb=07f31a87476a6b7589e3f08ba7414a64)
For more information on configuring default app settings, refer to the related article.
Define the first slice that will appear in a report
-20260401-022235.png?cb=ae1fd15bab34ceff427d1ca80cb8f9a2)
Consider disabling the All Issues slice when you want a different slice to be active when opening a report. In the example above, the Unassigned slice appears as the active slice.
This approach is useful when you have many assignees and want to focus on one at a time without displaying overall results. To achieve this:
-
Enable Hide All Issues slice in the report sidebar, as shown in the screenshot above.
-
In the Slice By section, select a field such as Assignee.
Alternatively, enable Hide All Issues slice, and create a Custom JQL slice and place it first in the list.
Display the issue count or remaining estimate per release
-20260401-000754.png?cb=5d0295ead5ba1c1e0b8c5b3cbda71b39)
You can use slices in a similar way to Quick Filters on the Releases page to display issues by status categories such as To Do, In Progress, and Done. In the example above, the slice shows issues with a To Do status category that belong to Version 2.
With slices, you combine multiple Quick filters and further customize both the data source and how results are displayed by following these steps:
-
Click Configure in the header.
-
Open the Slices tab in the report sidebar.
-
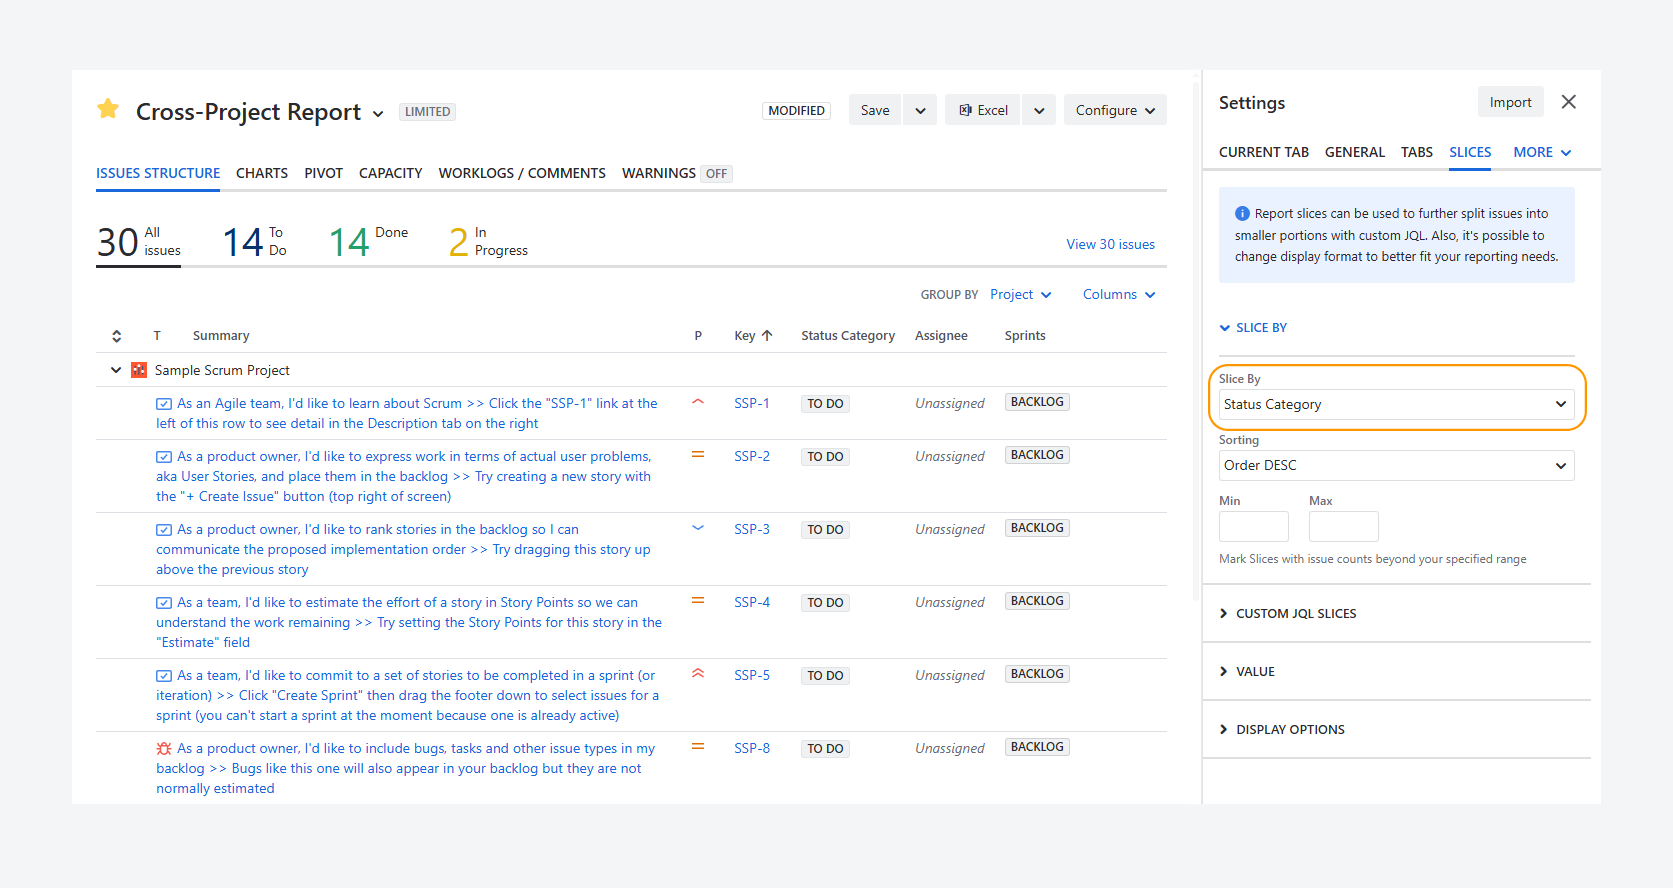
In the Slice By section, set Slice By to Status Category, as shown in the screenshot below.
-
(Optional) Add the Fix Versions column in the Summary and Breakdown sections to preview filtered issues.
-
In the Custom JQL slices section, click + Add Slice.
-
Enter a name and select a color for the slice, then add a JQL query:
statusCategory = "To Do" AND fixVersion = "Version 2.0". This query has the same effect as applying two Quick Filters. -
(Optional) Set a maximum value to display a warning when the slice exceeds it. In this example, attention may be needed because more than five issues have a To Do status category in Version 2.0. This may indicate that additional work—such as bugs or scope changes—has been added beyond the original five issues.
-20260401-010402.png?cb=86db215502bf67eb9e756cb5b39c4c19)
-
Review the slice’s appearance and order, then click the slice to apply it.
-
Click Save in the header.
After selecting the slice, you can view issues with a To Do status category that belong to Version 2, similar to the Releases page.
Using the Issue Structure tab type, you can view issues grouped by Epic and identify those missing a parent. While planning this version, you can use this tab to manually locate these issues and assign them to an Epic.
For a longer list, you can also create a slice that displays issues without an Epic—something that is not possible with Quick Filters on the Releases page.
This slice will use a JQL query: statusCategory = "To Do" AND fixVersion = "Version 2.0" and "Parent" is empty and issuetype is Epic
-20260401-015045.png?cb=9101558d03e9b3db514f65bca0b6cd7a)
How can you configure slices?
The Slices tab can be accessed from the report sidebar by following these steps:
-
Click Configure in the header section.
-
Select Slices in the dropdown.
-
Access four configuration sections: Slice by, Custom JQL Slices, Value, and Display options.
-20260325-215854.png?cb=7960e141883e8e65dd824f8b211ab299)
Which settings can you change?
The Slices tab contains four configuration sections:
-
Slice By: Select the field used to group issues and determine how the first set of slices is sorted. Optionally, set minimum and maximum values to trigger a warning when a slice exceeds these bounds.
-
Custom JQL Slices: Create a custom slice based on a JQL query (similar to using JQL as a report source). Assign a name and color to the slice, and reorder slices by dragging the grid icon (dotted handle) on the left side of the tab card. You can also set minimum and maximum values to trigger warnings when thresholds are exceeded.
-
Value: Choose the value to display for the slice and, if applicable, select a function such as summation, average, or median.
-
Display Options: Set how values are displayed—count, fraction or rate, or percentage.
Optionally, enable Show slices with no issues to monitor slices that currently contain no issues (e.g., overspent issues). You can also enable Hide All Issues slice when defining a different slice to be active when opening a report.
FAQ
Which slices are generated in a new report?
-20260401-192810.png?cb=8a60b86d2f5c65b565f18093d51ff8f4)
A newly created report displays slices grouped by Status Category, ordered by decreasing value, and showing the issue count for each group.
In the example above, there are 14 issues with a To Do status category, 14 with Done, and 2 with In Progress.
Can warning types enabled for the report impact slices?
-20260404-011842.png?cb=2869c787fc67e73e3494053d39eaf982)
No. Warning types are enabled in the Warnings tab, as shown in the screenshot above. These types do not affect warnings displayed in slices.
In this example, 10 issues are flagged in the Warnings tab: 8 are unassigned and 2 are overdue. These issues are visible when the All Issues slice is selected.
When you select another slice, such as Open Bugs, the report is filtered. As a result, only 2 of the 10 flagged issues remain visible.
In summary, enabling warning types does not affect slices. Selecting a slice only filters which flagged issues are shown.
-20260404-014328.png?cb=9e0ea3be23bdf43cf8cc933edeb26721)
To learn more about the Warning tab type, refer to this related article.
Which warning will appear when max and min values are flagged for a slice?
-20260404-013337.png?cb=dc23109f5132b464c1599186b2254e34)
When both minimum and maximum values are set for a custom slice, only the minimum warning is shown if the issue count does not meet the minimum threshold.
In the example above, the Open Bugs slice contains 9 issues. The maximum is set to 5 and the minimum to 10, so a warning appears indicating that the minimum threshold is not met.
Can you change the time units for slices?
Yes. You can change the time units for time-based fields across all report sections, including slices, by following these steps:
-
Click Configure in the header.
-
Select General from the dropdown.
-
Click Time Units and choose a value.
-20260325-221812.png?cb=7ce1a903a199420a667ddcee71b340de)
-
Click Save in the header.
Note that converting hours into days or weeks depends on the time tracking settings configured by your Jira admin, as shown in the screenshot below.
Changes to the time display format in Jira (for example, when set to Pretty) do not affect the time units used in a report.
-20260331-195343.png?cb=332ac71af42869841026d246b5614210)
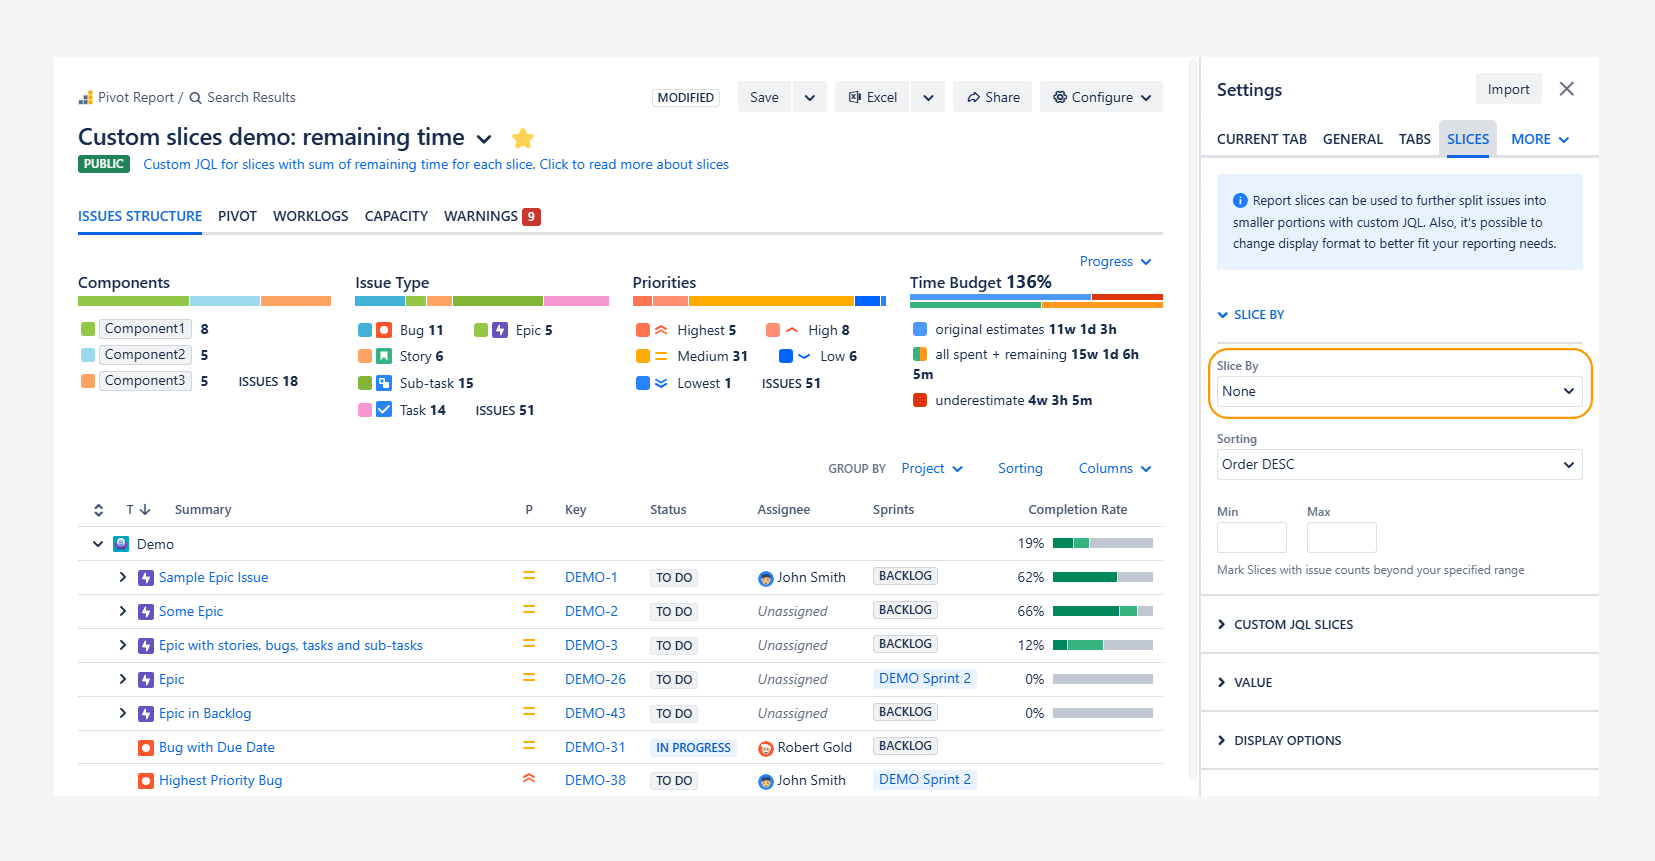
Can you show only custom slices?
Yes. You can hide slices based on a field and display only custom slices by following these steps:
-
Click Configure in the header.
-
Click the Slices tab in the report sidebar.
-
In the Slice By section, set Slice By to None, as shown in the screenshot below.
-
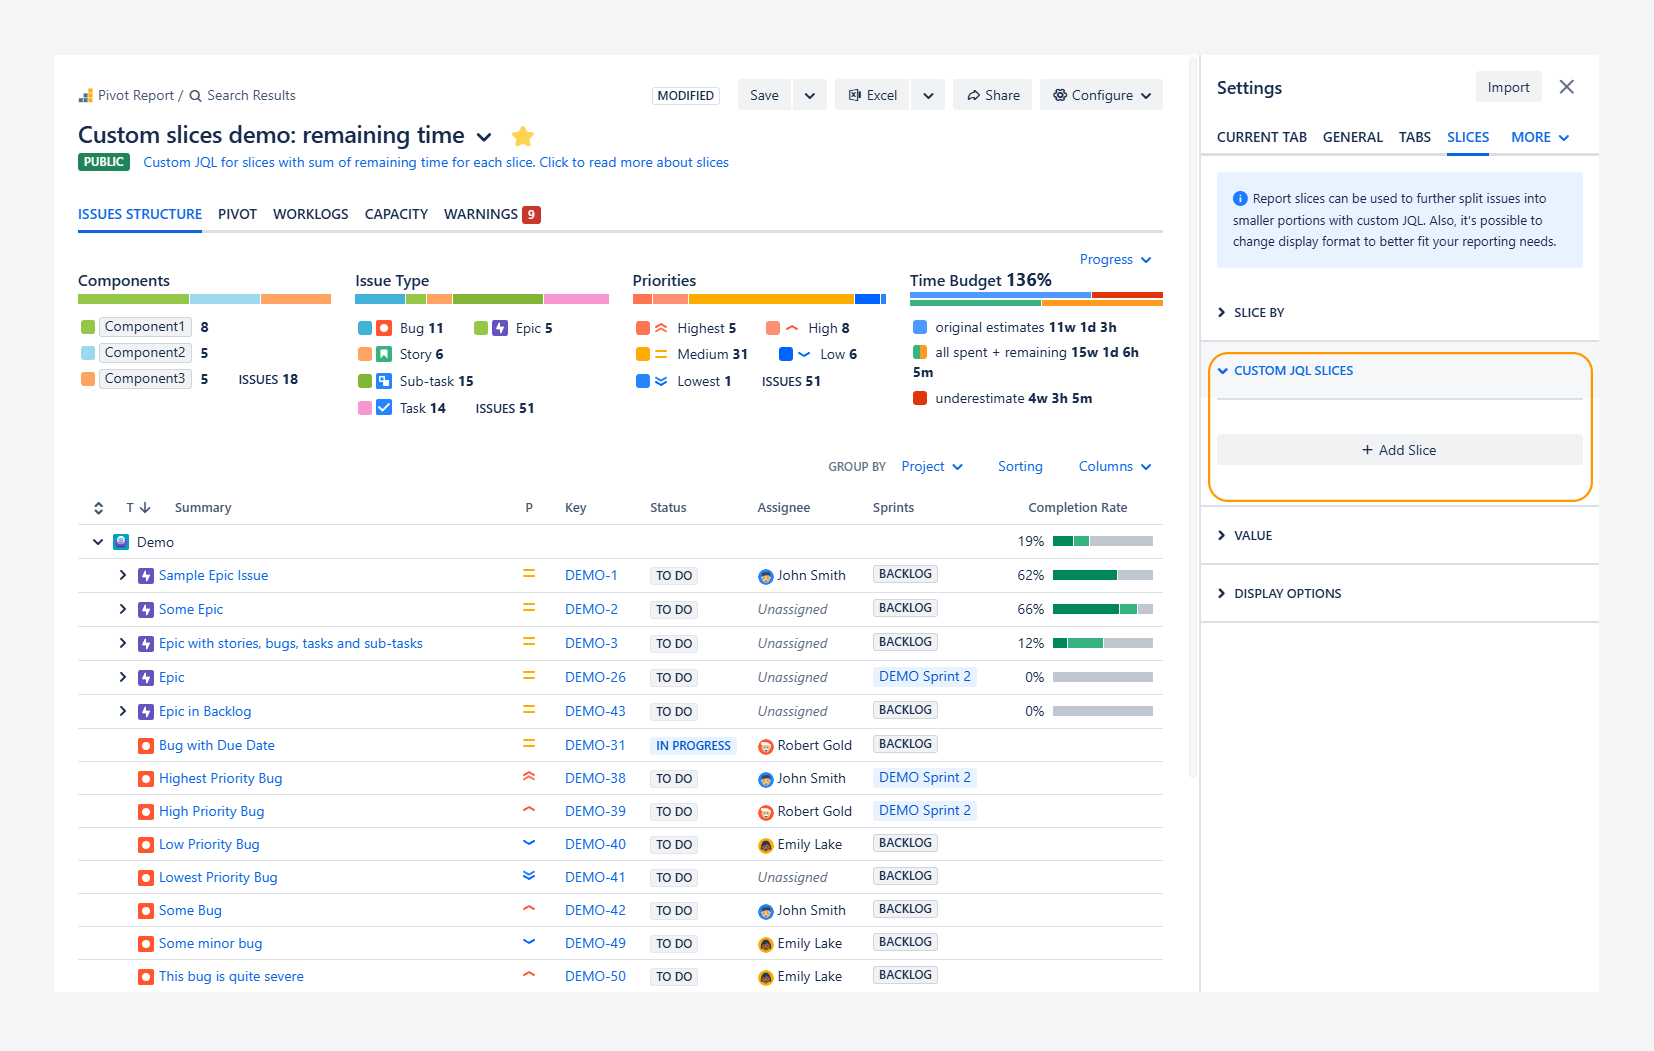
In the Custom JQL slices section, click + Add Slice to create a custom slice.
-
Click Save in the header.
Why don't all slices add up to the value in the 'All issues' slice?
-20260401-184533.png?cb=beddc6b5321c702908798c0784d2cdd3)
The All Issues slice does not represent the cumulative sum of all slices. For example, in the screenshot above, the value displayed is the issue count.
-
In the first set of slices, issues are grouped by Status Category.
-
These slices appear to the right of the All Issues slice, and their total (14 + 14 + 2) equals 30 issues.
-
The second set includes slices created with custom JQL. In this example, one slice shows three issues of the Bug type.
When using issue count as the value, the total of the first set always matches the All Issues slice.
However, when using other values or functions, the totals may differ because the All Issues slice always displays the issue count.
-20260401-193807.png?cb=d1013a1bee1e3a25b307b2b319065fc5)
When using percentage as the display format, the first set totals 100%. When using a rate, the total equals 1 (as shown by 14/30 + 14/30 + 2/30). This applies to any value, as long as a summation function is used.
Note that when using percentage or rate formats, it is recommended to use only one set of slices. Combining the first set of slices with custom JQL slices may result in totals that do not reach 100%, making the data harder to interpret.
Troubleshooting
Why can't you see the slices section?
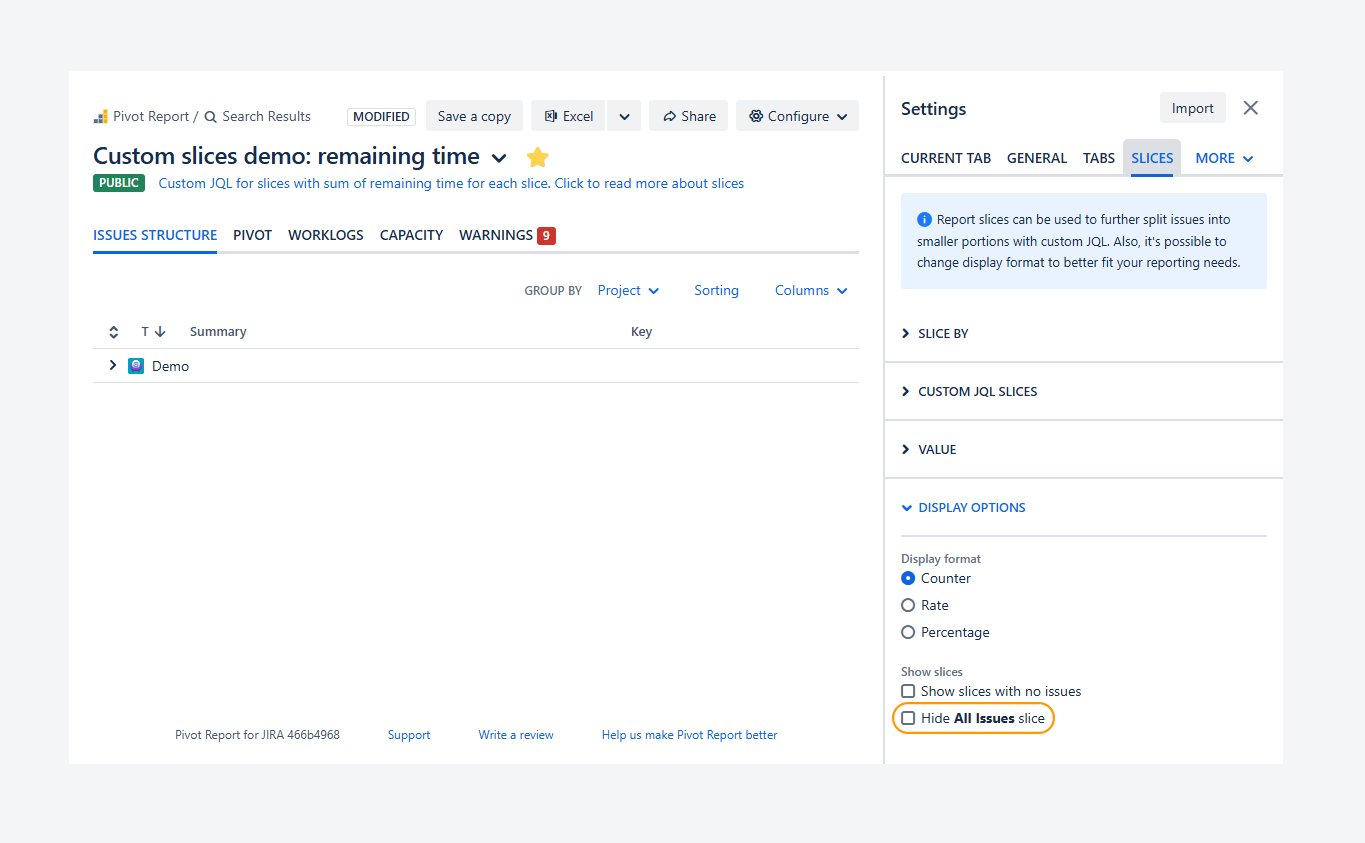
When the Hide All Issues slice option is disabled and no slices are configured, the slices section is empty and hidden. Follow these steps below to add slices in this section.
-
Click Configure in the header.
-
Select Current Tab from the dropdown.
-
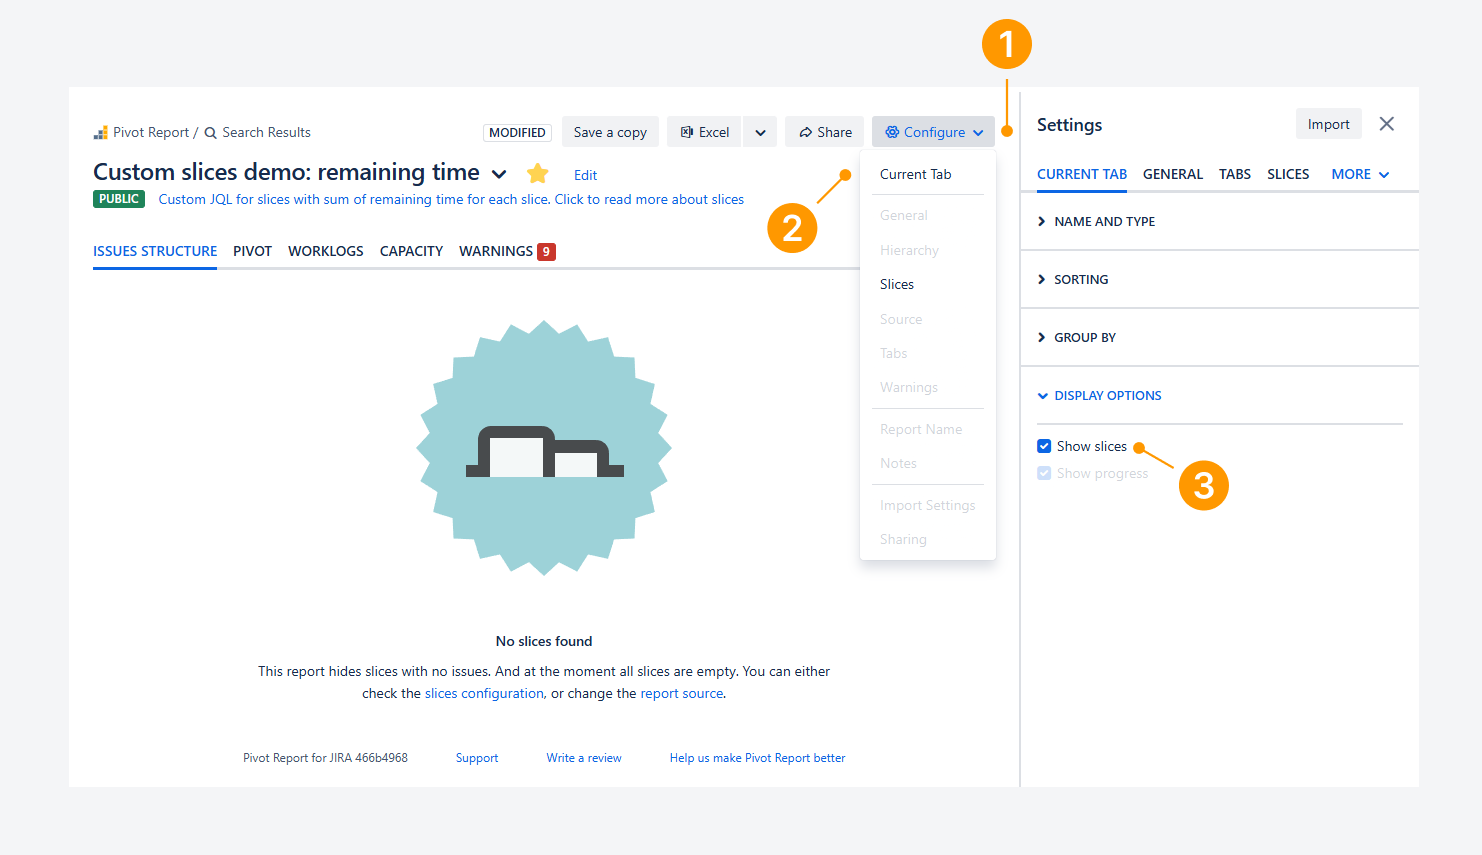
Check whether Show slices is enabled and turn it on. The screenshot below shows this option disabled.
-
Select Slices from the dropdown.
-
In the Slice By section, choose a field (for example, Status Category).
-
Click Save in the header.
Alternatively, check whether the Custom JQL slices section is empty. If it is, click + Add Slice to create a custom slice. This will make the slices section visible.
Why are you seeing the No slices found error?
-20260402-235933.png?cb=2a3c53aca55136848c493ac5ba00f8af)
You may see this error when no slices are configured and the All Issues slice is disabled. Follow these steps to resolve it:
-
Click Configure in the header.
-
Select Current Tab from the dropdown.
-
Disable Show slices (the screenshot below shows this option enabled).
-20260403-001806.png?cb=95fa5b38d73feebd9558f1804f064958)
Alternatively, if you want to use slices:
-
Keep Show slices enabled and select the Slices tab instead of Current Tab.
-
In the Slice By section, choose a field (for example, Status Category).
-20260403-005528.png?cb=531f39c6adbd02a6a880f5801f447f3a)
-
Click Save in the header.
If the error persists, check whether the Custom JQL slices section is empty.
If it is, click + Add Slice to create a custom slice. This will make the slices section visible.
-20260403-005850.png?cb=4b046a1a9a5c1076e407a1edeb090aec)
Why can’t you see all issues in the report?
If you can’t view all issues referenced by a report, even when no error appears, it may be due to a disabled feature or insufficient permissions to access the report source.
To check whether all issues are visible using report settings, follow these steps:
-
Use the All Issues slice. If the issue count does not match the number of issues referenced by the report source, and the source is not extended to include parent, child, or sibling issues, proceed to step 3.
-
If this slice is missing, disable Hide All Issues slice in the report sidebar.
Afterwards, click Save in the header section. The screenshot below shows this option disabled.
-20260325-230006.png?cb=1a91bf9c0af4540b2a146963349c5955)
-
If you are unable to view all issues after clicking on the All Issues slice, you may be missing permissions for accessing contents of the report source. Refer to a related article for verify your permissions.
How can you troubleshoot an unbound query error?
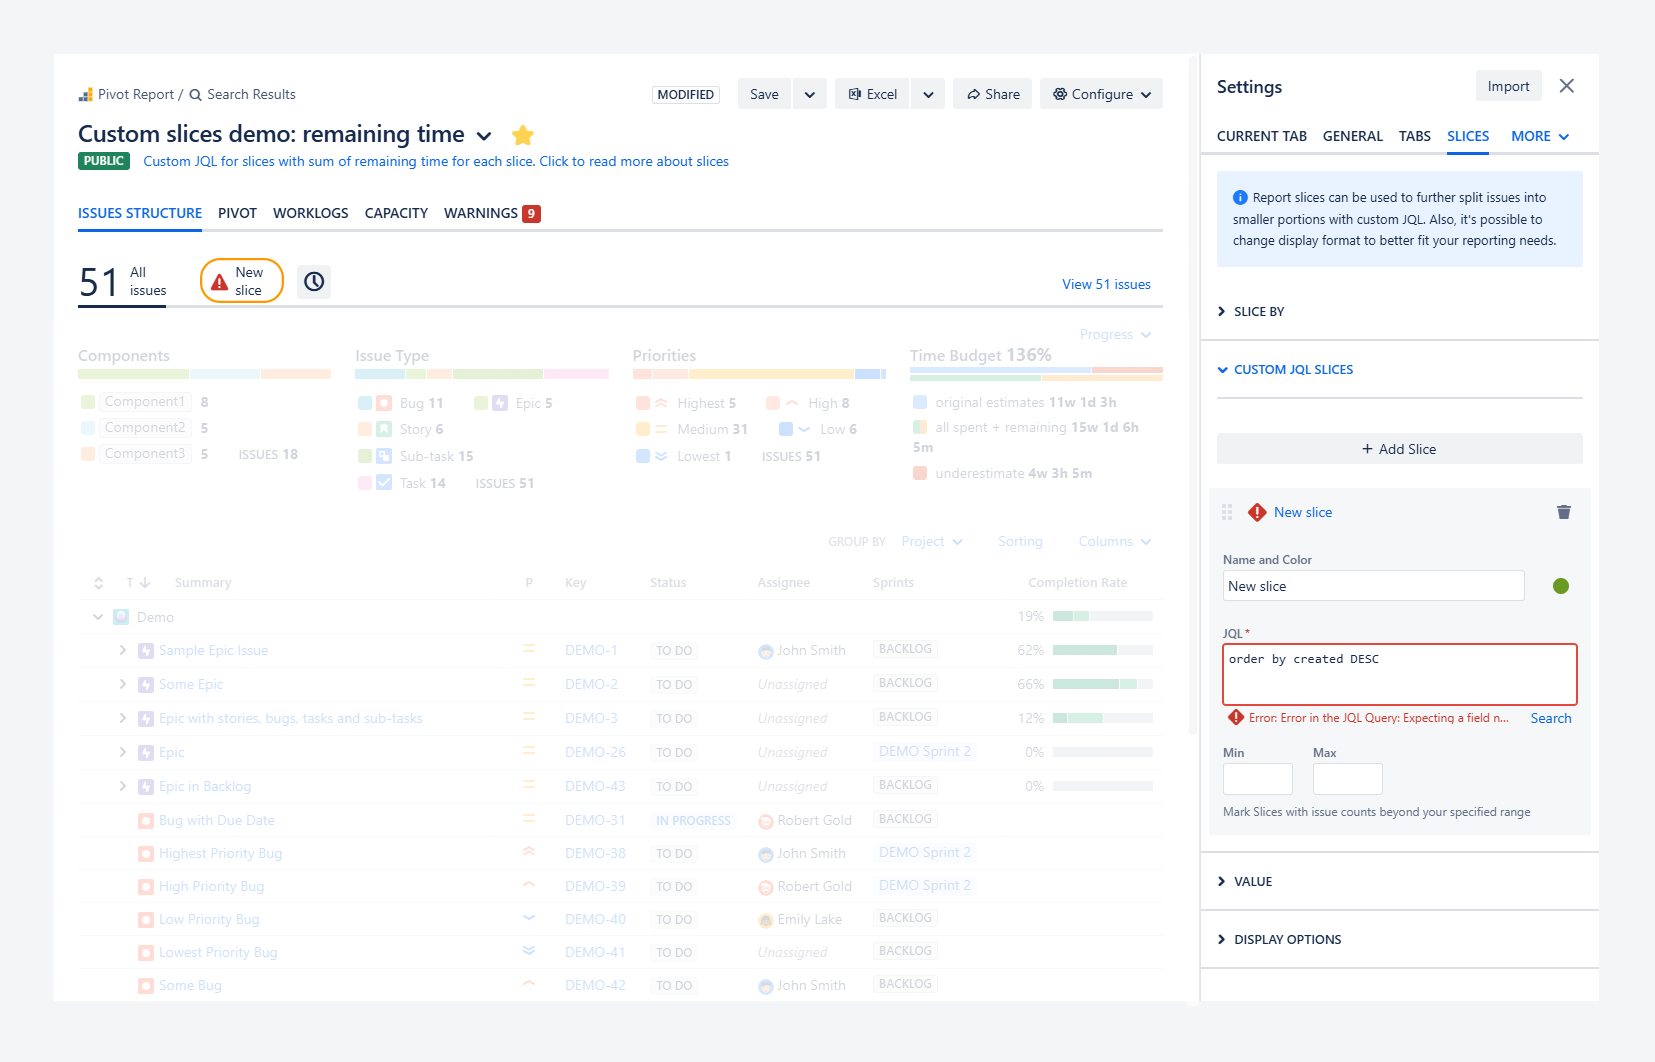
An error may appear when using an unbound JQL query for a slice, as shown in the screenshot above. This type of query does not specify any fields, such as project, assignee, issue type.
Instead, it only includes sorting terms, such as ORDER BY created DESC, which sorts results by creation date in descending order.
To resolve this issue, include filtering criteria in the query, such as a project, assignee, issue type, release, status, or priority.
If you have questions or need assistance, contact our support team via email or service desk. Our team is available Monday through Friday (9:00 AM to 7:00 PM GMT+7) to help with technical challenges or discuss improvements.