
-20260626-200256.png?cb=1b940bf27aaa851a6c4ca49f4ac3526e)
This article explains why and how to use progress indicators multiple sections of reports.
To test which indicators best fit your projects, try this demo.
Why should you use the app’s progress indicators?
Compared to the default indicators available in Jira, the app's progress indicators provide deeper insights into your data.
-
Flexible metrics: Show project-level progress using Story Points, issue status, or time-based system fields.
For example, you can display progress show the count of story points of resolved issues and compare them to the total amount of points, for each project or all projects in a report.
-
Derivative fields: Show the difference between time-based system fields using progress indicators, such as Estimate Accuracy, without creating custom fields in Jira or automations to calculate and store these values.
For example, Estimate Accuracy is calculated by dividing the Original Estimate by the sum of Time Spent and Remaining Time within the report.
-
Compact charts: Display which value is more frequent for a system field, without using JQL or a dashboard gadget.
For example, each value is represented by a segment of a horizontally stacked bar chart. The length of each is segment reflect the amount of issues compared to the whole.
-
Targeted search: Click on a segment of the bar chart to locate and edit issues individually or in bulk.
-
Customized indicators: Create custom number fields and display them as progress indicators.
How do Jira’s default progress indicators compare?
-20260709-040446.png?cb=e7fa5dc247be58da683c4bc9d2e32e41)
You can display Time Progress (or ∑Progress) in the Issue Navigator or by using one of the app's progress indicators, where it is available under a different name. This indicator takes into account lower hierarchy levels, including child issues such as sub-tasks.
Time progress (or ∑Progress) = [Spent Time / (Spent Time + Remaining Time)] × 100%
In the Issue Navigator, you can use this indicator to show the cumulative progress of an epic and its child issues. However, the Issue Navigator cannot display cumulative progress for an entire project.
Reports generated by the app support project-level cumulative progress, whereas Jira's default indicators do not.
-20260710-011114.png?cb=84da868f40d6cfd6362686068c9d9d71)
Compared to the Issue Navigator, the Issue View lets you display Time Progress alongside other Jira progress indicators. The available indicators are described below.
-
Progress (issue count): Shows how an issue is progressing based on the status category of the work items directly beneath it. This indicator is available in Jira's Issue View and Advanced Roadmaps. It does not take lower hierarchy levels, such as child issues, into account.
In the above example, the indicator shows 50% complete based only on the two tasks shown in the table, where one task is In Progress and the other is Done. If either task had sub-tasks, their statuses would not affect the indicator.
-
Time Progress (or ∑Progress): Shows how much work has been completed based on Time Spent divided by the sum of Time Spent and Remaining Time, while taking lower hierarchy levels, including child issues, into account. When an issue is resolved, the indicator shows 100% progress.
In Advanced Roadmaps, this indicator is named Progress (estimate) and can be configured to show the rate of completion based on Story Points instead of estimates.
In the above example, a parent issue shows 88% ∑Progress when the Time Spent and Remaining Time of its child issues are included. The same issue shows 99% Progress when only its own Time Spent and Remaining Time are considered.
-
Time tracking bar: Shows the Original estimate, Time Spent and Remaining Time for an issue. It is available in the issue details panel (shown in the screenshot as a pinned field for convenience).
The time tracking bar does not take lower hierarchy levels, such as sub-tasks, into account. In addition, it is limited to 100 child issues. If an epic has more than 100 child issues, such as stories or bugs, any additional child issues are not included in the calculation.
In the above example, the bar displays the Time Spent and Remaining Time for the two tasks shown in the table. If either task had sub-tasks, their estimates and logged time would not affect the bar.
Reports generated by the app provide alternatives to the Progress (issue count) indicator that take lower hierarchy levels into account and can be configured to exclude parent issues.
Compared to Progress (estimate), the app's progress indicators can also be configured to show progress based on Story Points instead of estimates.
In addition, the app's progress indicators are not subject to the same limitations as the Time Tracking bar. They can also show whether estimates are accurate or whether work has exceeded the original estimate.
Features and use cases
Display a Story Points in a slice, progress indicator, and column
-20260708-002710.png?cb=150e0322425b4371205f468a6c0a2c96)
In the above screenshot, the two indicators, Time Spent and Story Points, are shown in the Slices section, Progress section, and Summary section of the Issue Structure tab type. In other tab types, they are also shown in the Breakdown section.
The Story Points field behaves as an indicator or rollup field depending on the section.
-
Slices: Story Points is configured in the report sidebar to behave as a rollup field (Summation function). The sum of Story Points is shown for each project, where each slice represents a project.
-
Progress indicator: Story Points behaves as a single-value indicator that shows the sum of Story Points for all projects included in the report.
-
Rollup: Story Points behaves as a rollup field that displays the sum of Story Points for each project.
Time Spent is an indicator calculated based on the cumulative sum of all worklogs. It represents how much of the Original Estimate has been consumed. In comparison, Story Points is an indicator calculated based on the cumulative sum of story points.
In the example shown, the Time Spent indicator represents the cumulative sum of Time Spent across the three projects included in the report: 188.75 hours (71 + 78.25 + 39.5).
The Story Points indicator represents the cumulative sum of story points across the three projects included in the report: 12 points (5 + 7).
Display the issue count for system fields
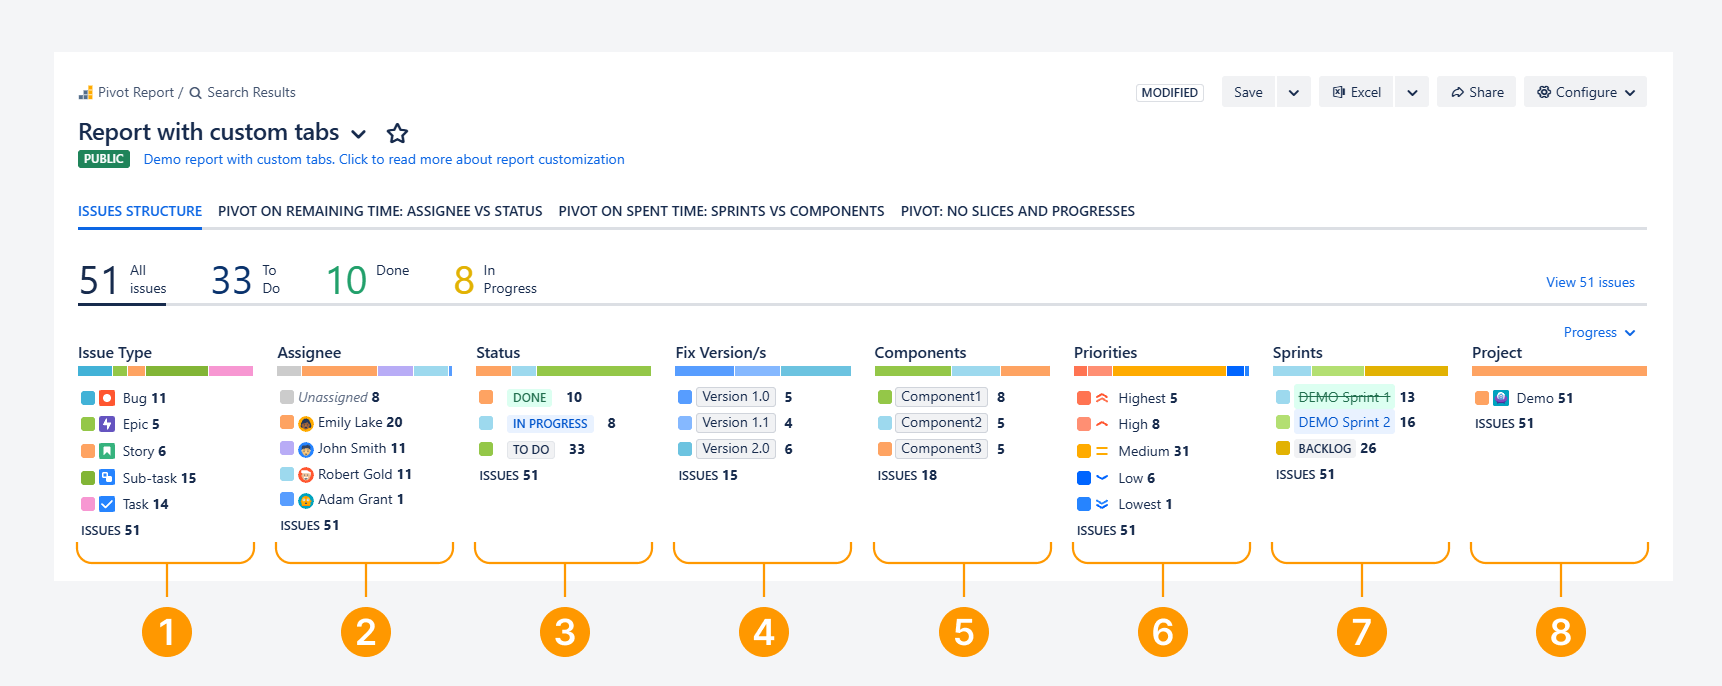
In the above screenshot, eight progress indicators are shown.
-
Each indicators lists the issue count for a single system field, such as Assignee, including cases when a single field can hold multiple values, such as a Sprint (which can hold the value of closed sprints and the active sprint).
-
Each indicator is displayed as a horizontal stacked bar of equal length. The length of each segment varies according to the issue count for each field value shown in the indicator.
The indicators are defined as follows:
-
Issue Type: Shows the issue count for each issue type, such as Bug, Epic, Story, Sub-task, or Task.
-
Assignee: Shows the issue count for each assignee, including unassigned issues. The screenshot above shows 51 issues, of which eight are unassigned. The remaining issues are assigned to one of four users.
Reporter (not shown): Shows the issue count for each user who created an issue included in the report. -
Status: Shows the issue count for each status, including custom workflow status, such as Waiting for Support.
Epic Status (not shown): Shows the issue count of epics grouped by status.
Status Category (not shown): Shows the issue count for each status category, such as To Do, In Progress, and Done. -
Fix Version: Shows the issue count for each fix version. The screenshot above shows 15 issues assigned to fix version.
-
Component: Shows the issue count for each component, such as Web, Integration, or Design. If a issue has multiple components, it is counted once for each assigned component. The overall issue count remains unchanged.
-
Priority: Shows the issue count for each priority, such as Highest, High, Medium, Low, and Lowest.
Parent Priority (not shown): Shows the issue count of parent issues grouped by priority. -
Sprint: Shows the issue count for each sprint, including closed sprints, the active sprint, and the backlog. An issue that spans multiple sprints, such as one that started in a closed sprint and remains in the active sprint, is assigned to both sprint values.
The example above above shows 13 issues assigned to a closed sprint, 16 issues assigned to the active sprint, and 26 issues assigned to the backlog.
Sprints Without Closed (not shown): Shows the issue count for sprints that are not closed, including the active sprint and the backlog.
-
Project: Shows the issue count for each project.
Project Category (not shown): Shows the issue count for each project category. Project categories are defined in project settings and are used to group related projects, for example by department (such as Marketing or Human Resources) or by budget classification (such as Operational Expense or Capital Expense). -
Link (not shown): Shows the issue count for a link type. For example, the Is blocked by link progress indicator shows the number of blocked issues and the issues that are blocking them.
Additional system fields and user-created custom fields are supported as progress indicators. If the field you need is not available, please contact our support team by email or through the service desk.
Display completion based on estimates (%) or Story Points (fraction)
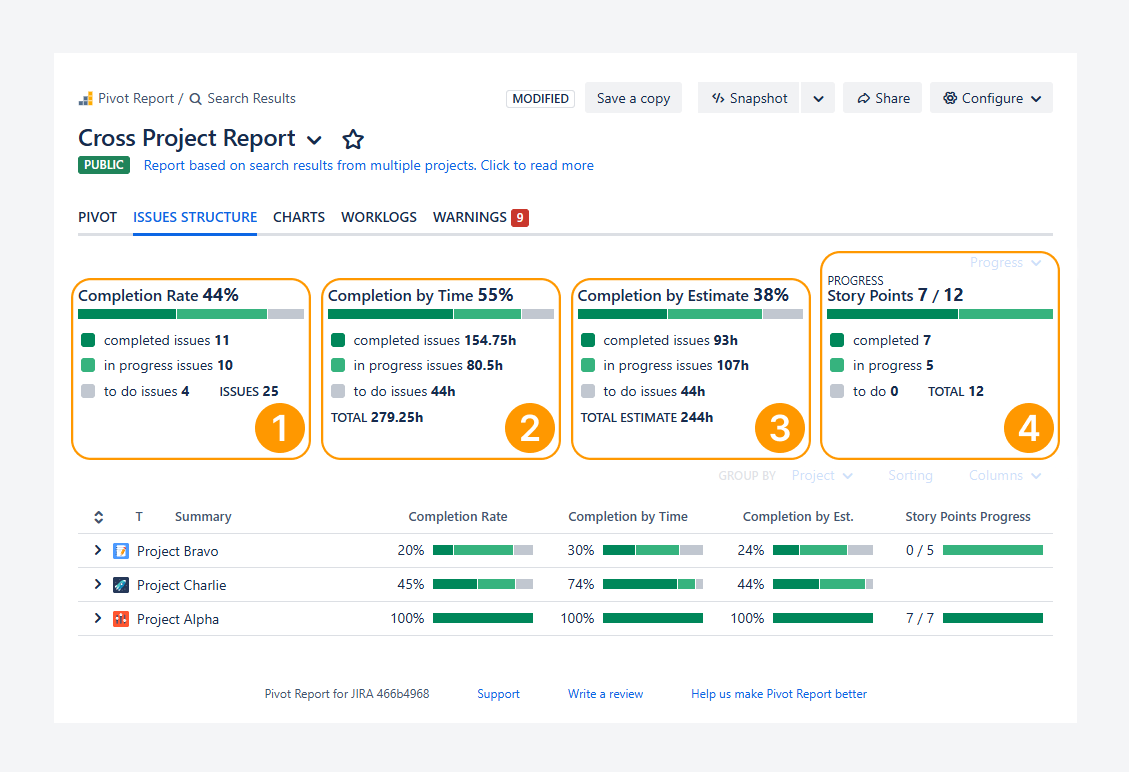
In the above screenshot, three indicators, Completion Rate, Completion by Time, and Story Points (Progress), are shown.
Each indicator is displayed as a horizontal stacked bar of equal length. The length of each segment varies according to the issue count, hours, or Story Points for each Status Category, depending on the indicator.
The indicators are defined as follows:
-
Completion Rate is an indicator calculated by dividing the count of resolved issues (issues with a Status Category of Done) by the total issue count.
Completion Rate = [Resolved Issues/ Total number of issues] x 100%
In the example shown, 44% (=11 / 25) of issues are completed, based on 11 issues with a Status Category of Done out of a total of 25 issues.
-
Completion by Time is an indicator calculated by dividing the cumulative time for completed issues by the total time, which consists of the following elements:
Completed issues: Time Spent and any Remaining Time for resolved issues (issues with a Status Category of Done).
In Progress issues: Time Spent and Remaining Time for issues with a Status Category of In Progress.
To Do issues: Time Spent and Remaining Time for issues with a Status Category of To Do.
Total time: The cumulative sum of time for Completed, In Progress, and To Do issues.
Completion by Time = (Completed issues / Total Time) × 100%
In the example shown, 55% (=154.75 / 279.25) of the Total Time, based on 154.75 hours logged (and remaining unspent time) for completed issues out of a total of 279.25 hours (=154.75 + 80.5 + 44).
Remaining unspent time: This value represents remaining time on closed issues where it was not reset to zero upon resolution or not manually updated.
-
Completion by Estimate is an indicator calculated by dividing the Original Estimate of resolved issues (issues with a Status Category of Done) by the total Original Estimate.
Completion by Estimate
= [Original Estimate of Resolved Issues/ Total Original Estimate] x 100%In the example shown, 38% (=93 / 244) of issues are completed, based on 93h Original Estimate for issues with a Status Category of Done out of a total of 244 hours (=93 + 107 + 44).
-
Story Points Progress is an indicator calculated by dividing the sum of Story Points for resolved issues (issues with a Status Category of Done) by the total Story Points.
Story Points Progress = [ Story Points for Resolved Issues/ Total Story Points]
In the example shown, 7 / 12 of the Story Points are achieved, based on 7 Story Points completed for issues with a Status Category of Done out of a total of 12 Story Points.
-
Story Points Rate (not shown) is an indicator calculated by dividing the sum of Story Points for resolved issues (issues with a Status Category of Done) by the total Story Points.
Story Points Progress = [ Story Points for Resolved Issues/ Total Story Points] × 100%
Display estimate accuracy, overspent, and Time Progress
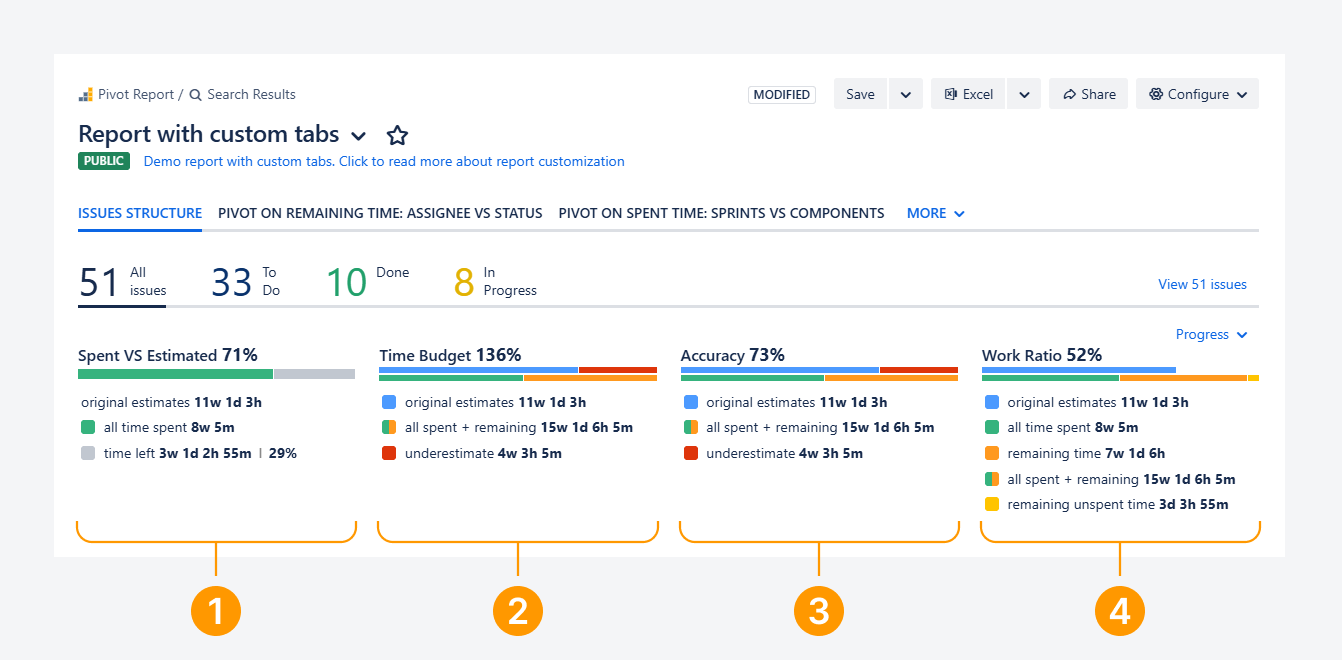
In the above screenshot, four progress indicators, Spent Vs Estimated, Time Budget, Estimate Accuracy, and Work Ratio, are shown. These indicators are derived from four Jira system fields: Original Estimate, Time Spent, Time Remaining, and Status Category.
The indicators are defined as follows:
-
Spent VS Estimated: This indicator lets you view the percentage of time already used.
If you exceed the initially estimated time in the Original Estimate, the Spent VS Estimated percentage will surpass 100%. -
Estimate Accuracy is calculated by dividing the Original Estimate by the sum of Time Spent and Remaining Time. This indicator measures how accurately work was estimated before it began by showing the combined effect of overestimating and underestimating effort.
A value below 100% indicates that the original estimate was not accurate. For example, a value of 90% means the estimate was 90% accurate.
IF Spent Time+ Remaining Open > Original Estimate
THEN Estimate Accuracy = [Original Estimate / (Spent Time + Remaining Open)] × 100%IF Spent Time + Remaining Open < Original Estimate
THEN Estimate Accuracy = [(Spent Time + Remaining Open) / Original Estimate] × 100%
Remaining Open represents the total Remaining Time across all issue that are currently in the To Do or In Progress status categories.
-
Time Budget is calculated by dividing the sum of Time Spent and Remaining Time by the Original Estimate. This indicator measures whether work is staying within the planned budget.
A value above 100% indicates that the estimate has been exceeded. For example, a Time Budget of 110% means the original estimate has been exceeded by 10%.
Time Budget = [(Spent Time + Remaining Time) / Original Estimate] × 100%
-
Work Ratio is calculated by dividing Time Spent by the sum of Time Spent and Remaining Time, similarly to Jira's Time Progress field. This indicator measures progress rather than estimate accuracy or budget overruns. It shows how much of the current scope has been completed relative to the work that remains.
If the remaining time is increased during the issue's lifecycle, the calculation automatically reflects the revised scope.
For calculation examples, including an example of how the Status Category affects the indicator, refer to the related article.
Work Ratio = [Spent Time / (Spent Time + Remaining Time)] × 100%
This indicator is available after installing the app and differ from the default Work Ratio available in the Issue Navigator.
Jira’s default Work Ratio measures progress by dividing Time Spent by the Original Estimate. This calculation applies only to the issue itself and does not include data from child issues.
Display estimate accuracy as a progress indicator and column
-20260708-025127.png?cb=019ec5c4045359f568d72322d8b8917c)
In the above screenshot, the three indicators, Time Spent, Story Points, and Estimate Accuracy, are shown in the Progress section and as rollup fields in the columns of the Summary section of the Issue Structure tab type. In other tab types, they are also shown in the Breakdown section.
The Estimate Accuracy indicator and rollup field are defined as follows:
-
Estimate Accuracy is an indicator calculated by dividing the Original Estimate by the sum of Time Spent and Remaining Time. It measures how accurately work was estimated before it began by showing the combined effect of overestimating and underestimating effort.
In the example shown, the indicator represents the combined Estimate Accuracy across the three projects included in the report.
-
∑Estimate Accuracy is both an indicator and a rollup field available for every row in the Summary section.
In the example shown, the rollup field displays the Estimate Accuracy for each project by dividing the Original Estimate by the sum of Time Spent and Remaining Time for that project.
Display Time in Status as a column indicator
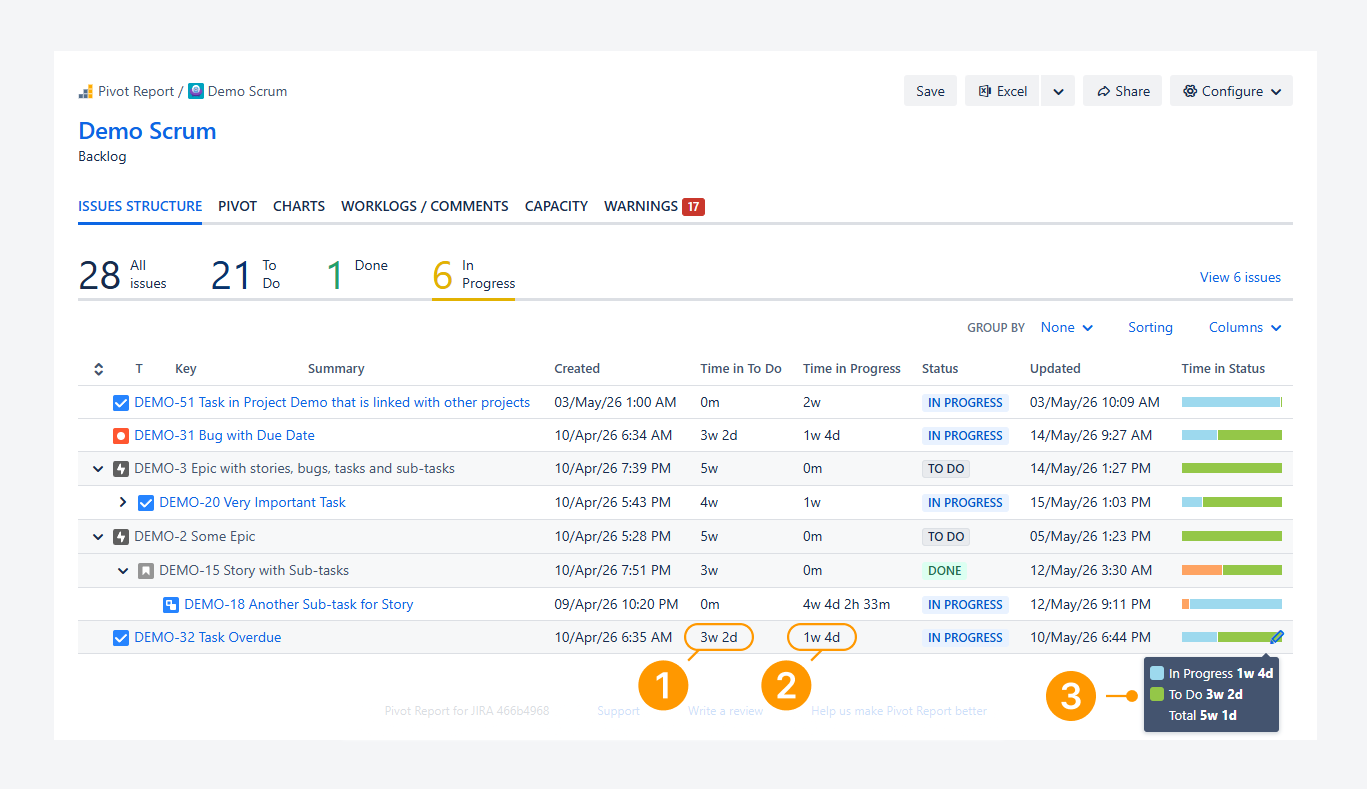
Time in Status can be measured in four ways.
-
Time in To Do: This measurement shows how long an issue remains in the To Do status category, starting from the Created date until the current date and time. The value stops increasing when the issue moves to either In Progress or Done.
In the example above, the issue spent more than three weeks in the To Do status category.
-
Time in Progress: This measurement shows how long an issue remains in the In Progress status category, starting from the moment it enters that category until the current date and time. The value stops increasing when the issue moves to Done.
In the example above, the issue has spent more than one week in the In Progress status category to date.
-
Time in Status: This measurement displays a horizontally stacked bar that shows how much time elapsed between each status transition. The total time appears in a tooltip when you hover over or click the bar.
In the example above, the right segment represents Time in To Do, while the left segment represents Time in Progress.
-
Time in Status Group (not shown): This measurement displays a horizontally stacked bar that shows how much time elapsed within each status category.
To learn more about Time in Status, refer to the related article.
Display indicators withing as dashboard gadgets
-20260708-004729.png?cb=d5514d40dd275bda6b03d8e6d315a9db)
Use the Pivot Report Progress gadget to display progress indicators on Jira dashboards in both Cloud and Data Center.
Measure SLA within indicators in JSM projects
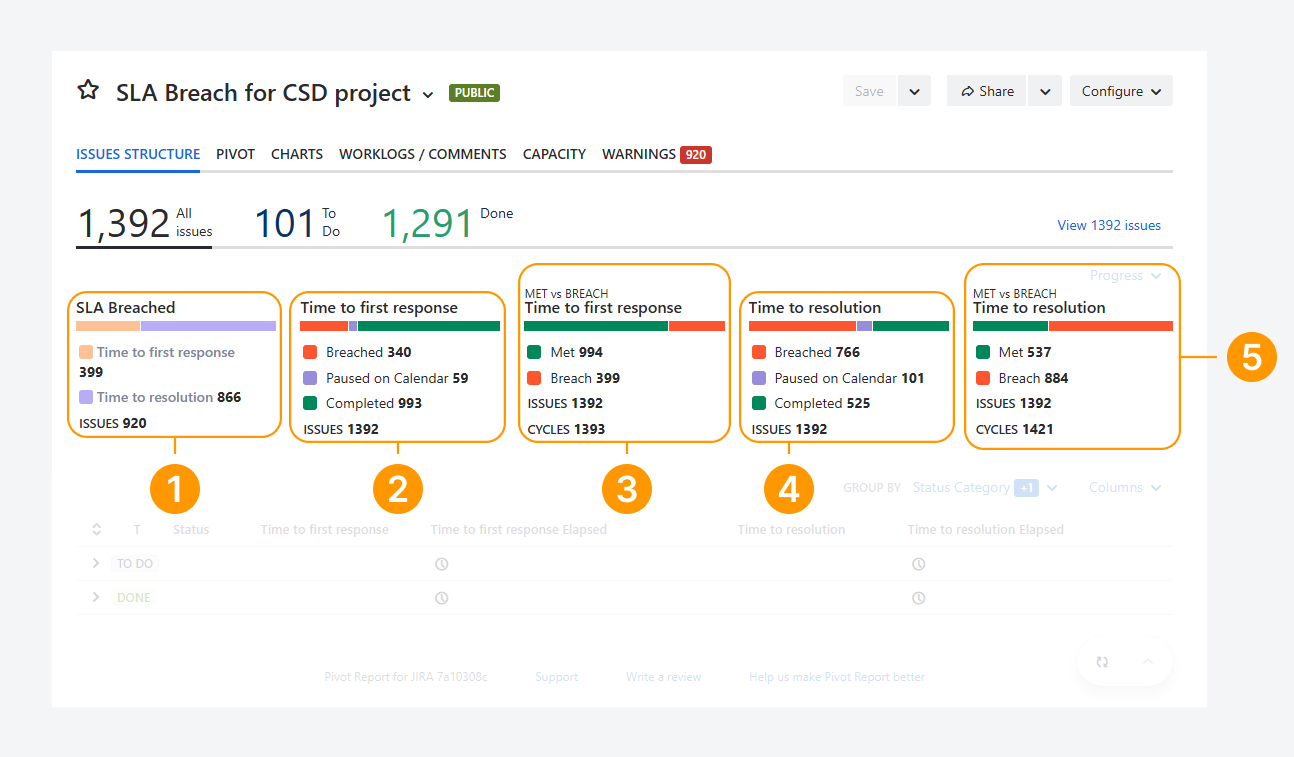
The app supports the following Jira Service Management (JSM) progress indicators:
-
SLA Breached: This indicator returns the list of issues whose current or most recent SLA cycle failed to meet its target.
For example, 399 issues have breached the Time to First Response target, and 860 issues have breached the Time to Resolution target.
The SLA Ever Breached indicator is also available, although it is not shown in the example. It returns issues that failed to meet their target in any SLA cycle.
-
Time to First Response: This indicator shows issues whose Time to First Response SLA is in a Breached, Paused, or Completed state.
For example, 993 of 1,392 issues were completed and met the target, 340 issues breached the target, and 59 issues were paused.
-
Time to First Response: Met vs Breached: This indicator returns issues that either met or failed to meet their Time to First Response target.
For example, 399 issues (340 breached issues and 59 paused issues) failed to meet the target, while 994 issues (993 completed issues and 1 successful cycle) met the target.
-
Time to Resolution: This indicator shows issues whose Time to Resolution SLA is in a Breached, Paused, or Completed state.
For example, 525 of 1,392 issues were completed and met the target, 766 issues breached the target, and 101 issues were paused.
-
Time to Resolution: Met vs Breached: This indicator returns issues that either met or failed to meet their Time to Resolution target.
For example, 884 issues (766 breached issues, 101 paused issues, and 17 failed cycles) failed to meet the target, while 537 issues (525 completed issues and 12 successful cycles) met the target.
Display the cumulative sum for a formula or custom field
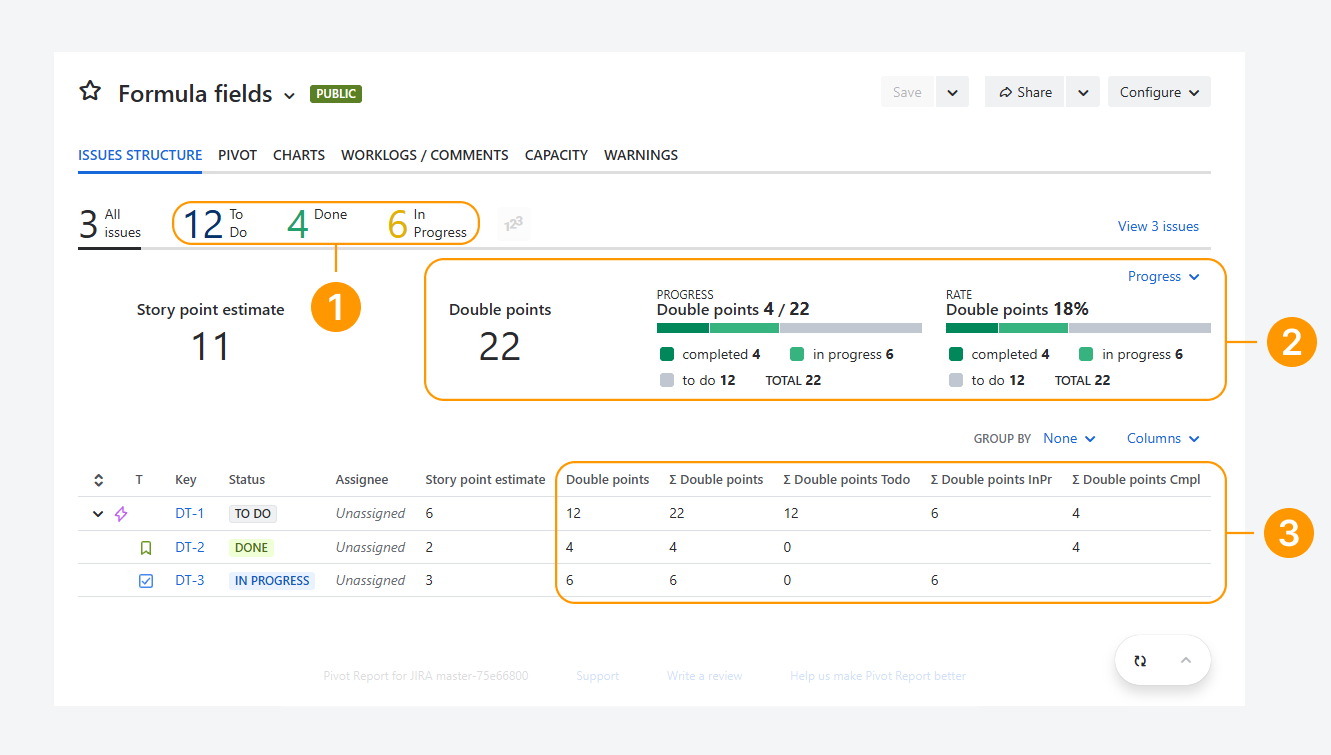
In the example above, the Double points formula field is shown in three report sections. This field is calculated by multiplying the Story points estimate value, which can be set in the Issue view.
The formula field is available in the following sections:
-
Slices: The rollup value of the field is shown for each status category.
For example, To Do issues have a total of 12 Double points. -
Progress indicators: The field can be used in up to three progress indicators.
A single-value indicator can show the sum of Double points (22 Double points) for all projects included in the report.You can also show the number of Double points completed relative to the total as a fraction or percentage. In this example, one resolved issue has 4 Double points out of 22, which means that 18% (=4 / 22) of the Double points have been resolved.
-
Breakdown: The field's value, rollup value, or rollup value by status category can be shown as a column in the Breakdown section of any tab type except Charts. It can also be shown in the Summary section of the Issue Structure tab, as shown above.
-
Summary: (not shown) In the Summary section of the Pivot tab type, Double points can be shown as a value in a row or as a rollup sum in each cell of a pivot table.
You can also display a Jira custom field by using the Number field type instead of a formula field type. The value of this custom field is set in the Issue view.
How can you display progress indicators?
You can display indicators in the progress section by following these steps:
-
Click the Progress dropdown.
-
Select the indicators you want to display.
-
(Optional) After selecting indicators, you can reorder them by hovering over an indicator name and using the grip icon that appears.
FAQ
Can you exclude Parent issues and change how the Completion rate is calculated?
-20260707-234026.png?cb=e7e8a9212f6a76d742fd92d71f0b2990)
Yes. You can change how progress is calculated for the Completion rate progress indicator.
For instructions, follow the steps described in the separate article.
Can you show the Satisfaction rating as an indicator?
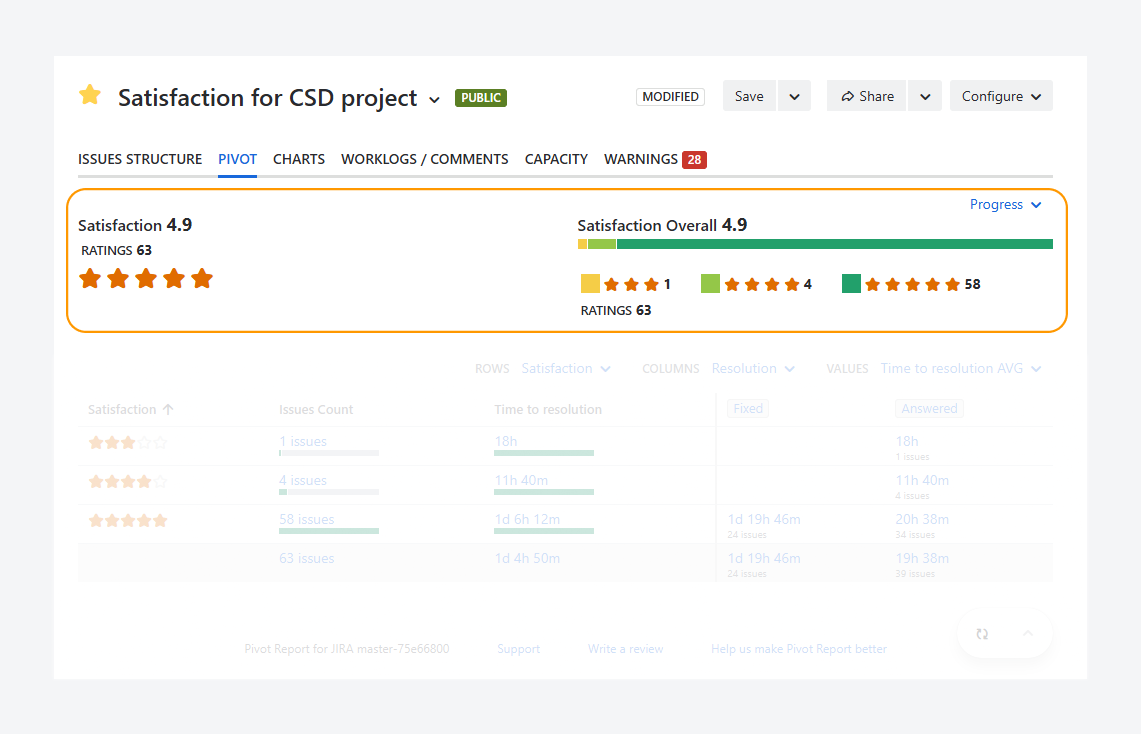
Yes. You can display the Satisfaction rating as a progress indicator for a Jira Service Management (JSM) project, as described in the related article.
Troubleshooting
Why aren't the indicator values adding up to the expected issue count?
-20260708-230134.png?cb=eb6f930f122408918c58ccb4970b94c2)
In the above screenshot, three indicators, Assignee, Fix Versions, and Components, are shown. The total issue count for two of these indicators does not match the expected All Issues value of 51, as explained below.
-
Assignee: Shows the issue count for each assignee, including unassigned issues.
In the example shown, all 51 issues are included. Eight issues are unassigned, and the remaining issues are assigned to one of four users.
-
Fix Versions: Shows the issue count for each fix version, excluding issues that do not have a fix version.
In the example shown, 15 issue =(5 + 4 + 6) have at least one fix version.
The remaining 36 issues (=51 - 51) do not have a fix version and are therefore not included in the indicator.
-
Components: Shows the issue count for each component, such as Web, Integration, or Design, excluding issues that do not have a component.
In the example shown, 18 issues (=8 + 5 + 5) have at least one component.
The remaining 33 issues (=51 - 18) do not have a component and are therefore not included in the indicator.
These examples show that the issue count displayed by an indicator can be lower than the total issue count for the report.
In contrast, the cumulative issue count across the individual values within an indicator can exceed the indicator's total issue count.
For example, an issue can be assigned to multiple fix versions. If an issue that is already assigned to Version 1.0 is also assigned to Version 1.1, the count for each version increases independently.
The count for Version 1.0 could remain at 5, while the count for Version 1.1 increases from 4 to 5. However, the total number of issues represented by the indicator remains 15 because the same issue is counted only once in the overall total.
As a result, the total length of the horizontal bar remains unchanged, while only the relative size of each segment changes.
If you have questions or need assistance, contact our support team via email or service desk. Our team is available Monday through Friday (9:00 AM to 7:00 PM GMT+7) to help with technical challenges or discuss improvements.