
This article explains why and how to use the Worklogs/Comments tab type within a report.
Why should you use this tab type?
The Worklogs tab type serves two main purposes.
First, it lets you create reports focused on issue comments. For Jira Service Management projects, you can distinguish between internal and external comments. You can also tabulate the number of comments, by type, per issue or by any other available field.
Second, if you use Jira time tracking, the Worklogs tab lets you analyze time logged for an issue by user and by time interval. Unlike the Pivot tab, it allows you to filter worklogs directly based on who logged the time and when it was logged.
In addition, the Worklogs tab provides more advanced analysis capabilities than the Worklog Report available on the Atlassian Marketplace.
What is the difference between Time Spent and Time Logged?
Time Spent represents how much of the original estimate has been consumed. It is mainly used as a progress indicator to show how much work has been completed relative to what was planned.
Time Logged represents the actual work recorded by users during a specific period. You obtain Time Logged by filtering Time Spent using a defined time interval.
For example, if you want to see how much time was logged during the last sprint, you can set an interval that matches the sprint’s start and end dates. The filtered result shows the time logged only within that period.
Features and use cases
Display who is or was working on the highest-priority issues each week
-20260319-021021.png?cb=ad58deb21452dcfc2b01e7552b64fefd)
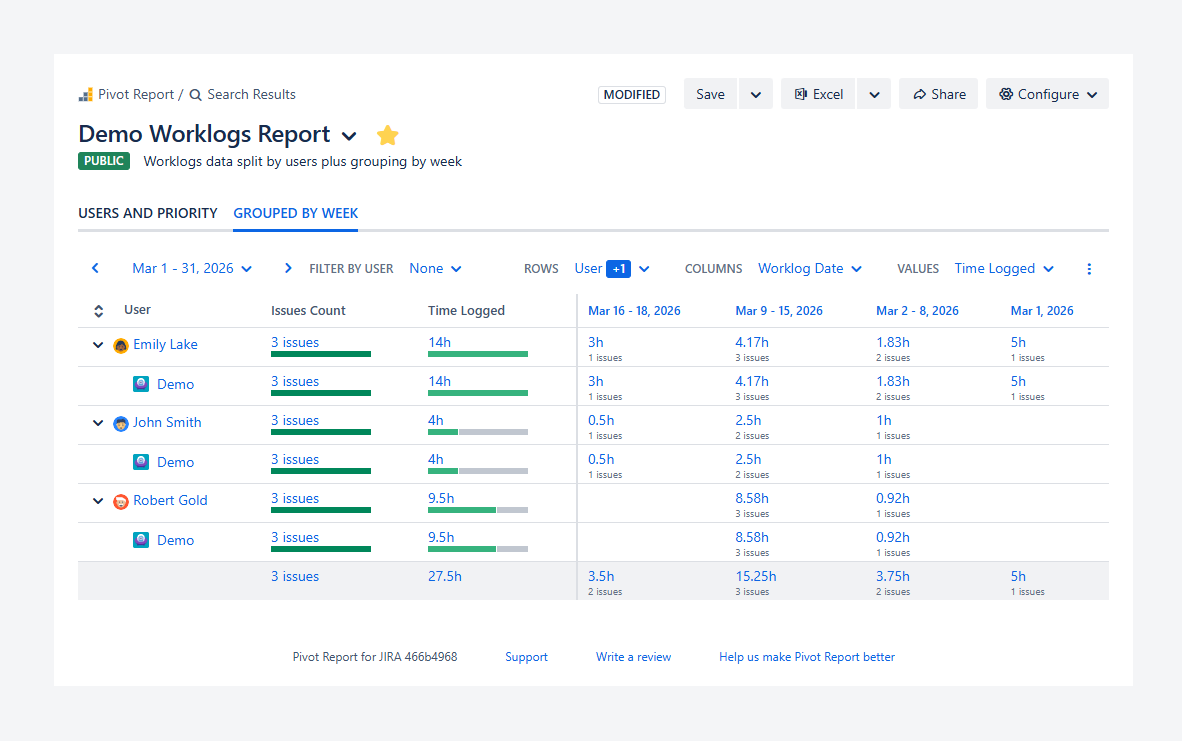
You can display who is or was working on the highest-priority issues each week by using the Worklogs/Comments tab type, as shown in the screenshot above.
-20260319-021930.png?cb=dc25fa0c75c21ca679b213a45245fbb0)
In this example, the Worklogs/Comments tab type is used twice and renamed based on its configuration. One tab shows worklog data grouped by user and priority, while the other shows the same data split by week.
This report layout is available for testing on the demo site.
How can you configure the Worklogs tab?
The Worklogs tab type includes the following options for configuring the table located within Summary section.
-
Name and type: Click inside the text box to rename the selected tab.
-
Rows, Columns, and Values: Check these options to modify the contents of the Summary section for the selected tab.
-
Breakdown: Click on the toggle switch to either hide or show the Breakdown section within the selected tab. This options is available for Pivot, Capacity, Worklogs, and Warnings tab types.
-
Display options: Check Show slices, Show progress, or both, to show these sections within the selected tab.
-
Interval: Set Start and End dates for the period being filtered.
Rows, Columns, and Values are introduced further below.
Rows
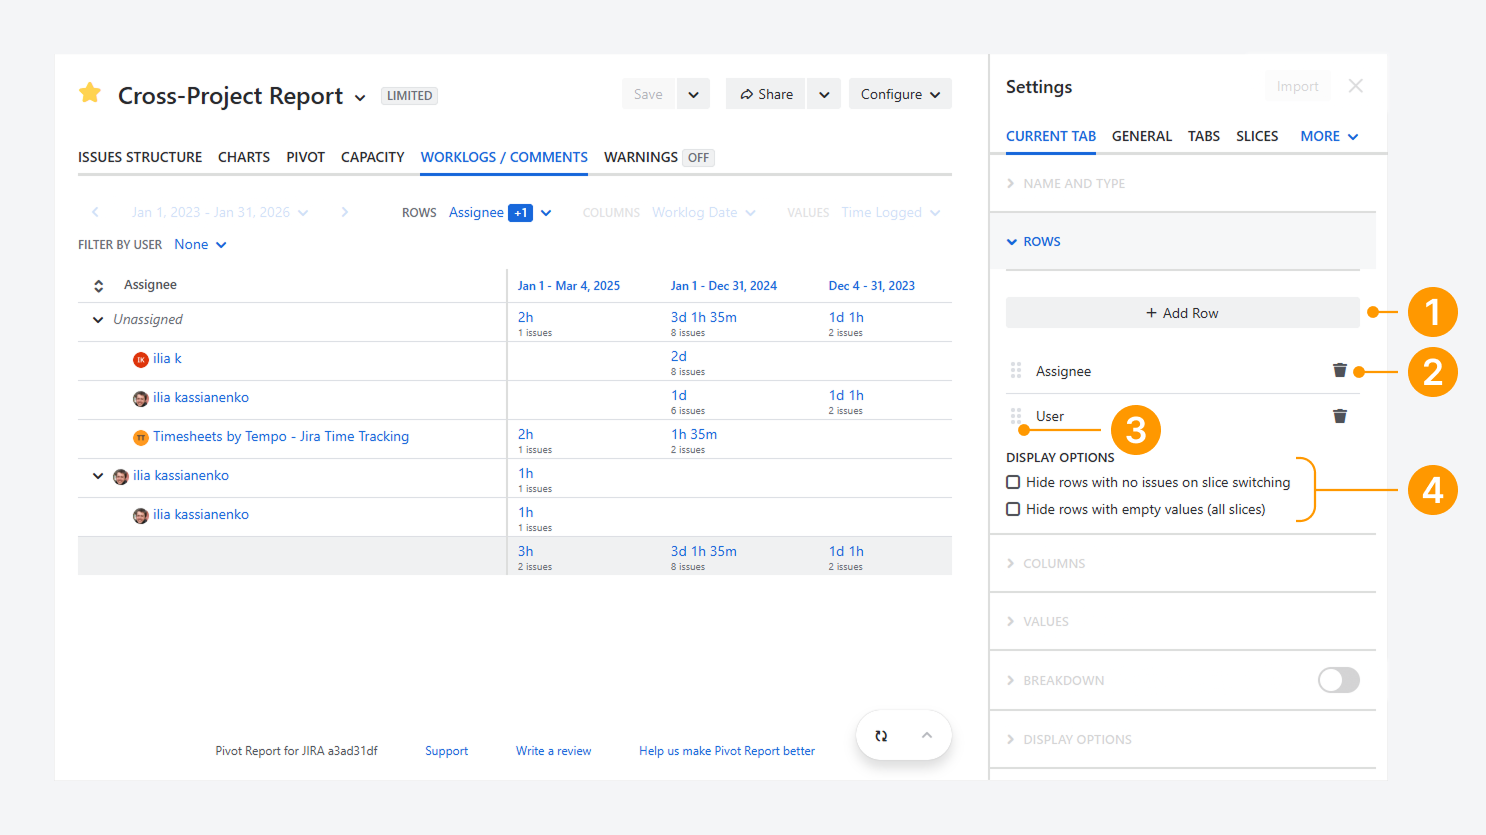
The options shown in the screenshot allow you to reorder, remove existing rows, or add new ones.
-
Activate a row: Click Add Row, open the dropdown menu, and select the row you want to add.
-
Remove a row: Click the bin icon on the row card to remove it.
-
Reorder a row: Drag the row using the grid icon (the dotted handle on the left side of the card) to change its position.
-
Check display options: Select the appropriate checkbox to hide rows with no issues, either when switching between slices or across all slices, including the All Issues slice.
Columns
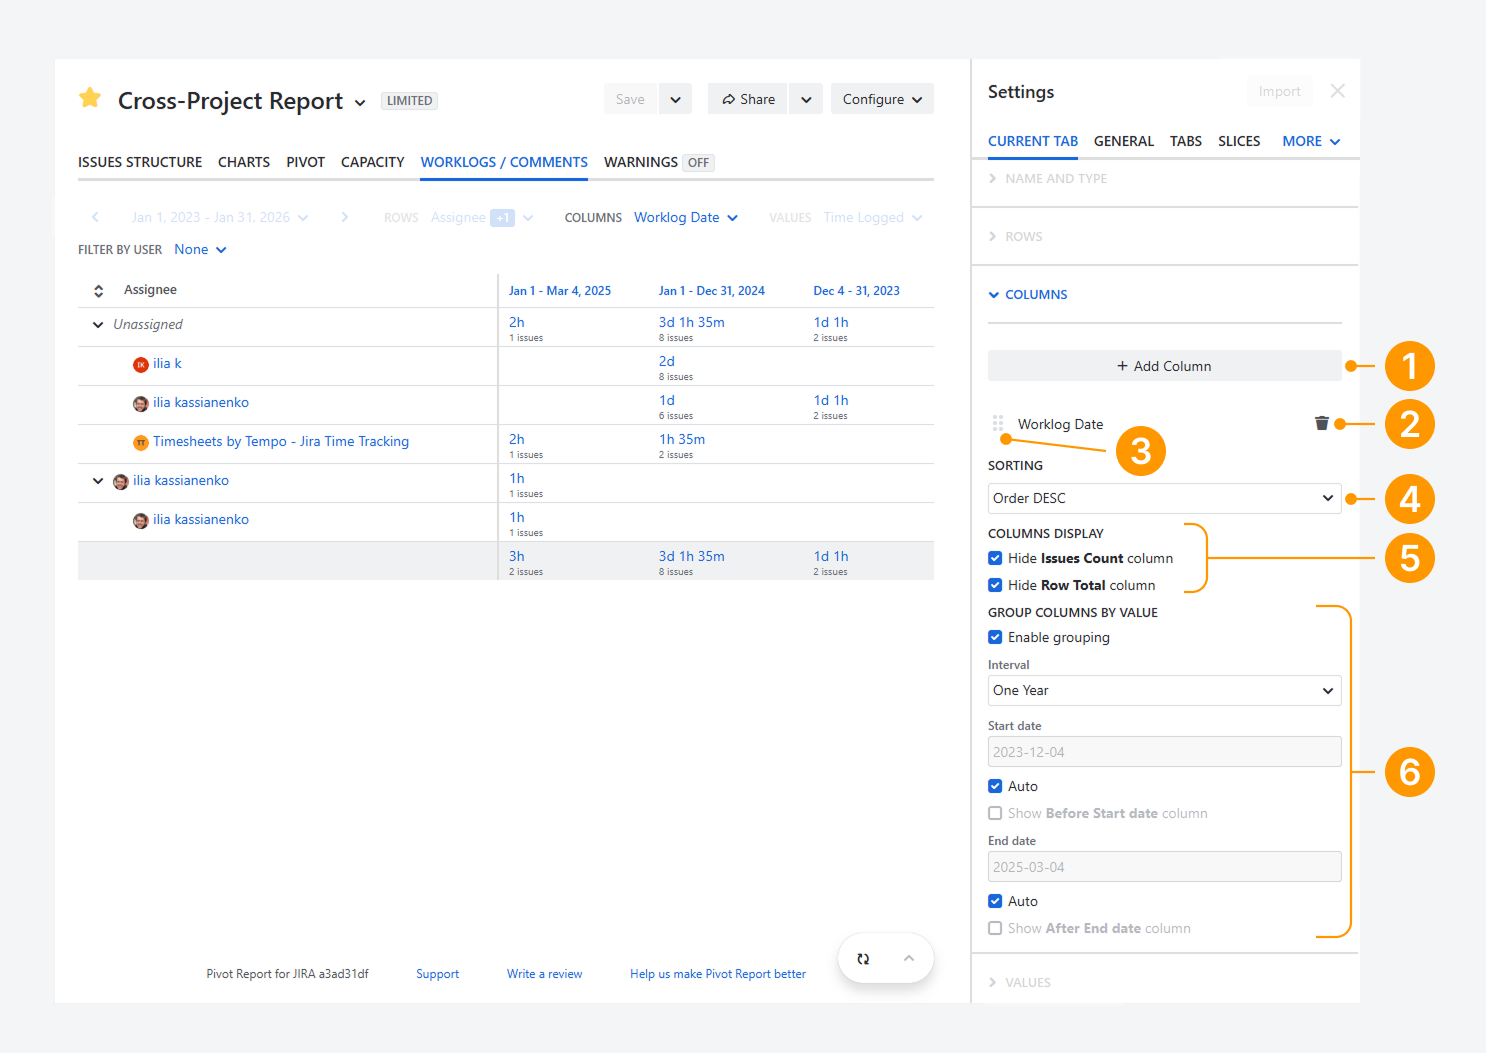
The options shown in the screenshot let you manage columns by reordering them, removing existing ones, adding new ones, hiding default columns, or grouping column values.
-
Activate a column: Click Add Column, open the dropdown menu, and select the column you want to add.
-
Remove a column: Click the bin icon on the column card to remove it.
-
Reorder a column: Drag the column using the grid icon (the dotted handle on the left side of the card) to change its position.
-
Sort a column: Open the column’s dropdown menu and choose how to sort the column: by order, issue count, or value (based on the column subtotal). Then select whether the sorting should be ascending or descending. If multiple column cards are present, only the column shown in the top card will be sorted.
Fields such as Status, Priority, and Issue Type follow the ranking defined in Jira settings, which you can customize. Date fields are sorted chronologically when ascending order is selected.
-
Column display options: Select the relevant checkbox to hide default columns in the Summary section, such as those showing issue counts or row totals.
-
Value grouping: Enable Grouping to group column values. This option is available when you use date-based fields, such as comment date, worklog date, or due date, as well as number-based fields like comments, story points, or other numeric fields. If multiple column cards are present, only the column shown in the top card is grouped.
For date fields, values can be grouped by one week, two weeks, one month, one quarter, or one year. You can define the start and end dates manually or allow them to be set automatically.
For number-based fields, such as comments or story points, values are grouped using a number that defines the step between each group. Start and end values can also be set manually or left to auto-set. Only whole numbers can be entered.
Values
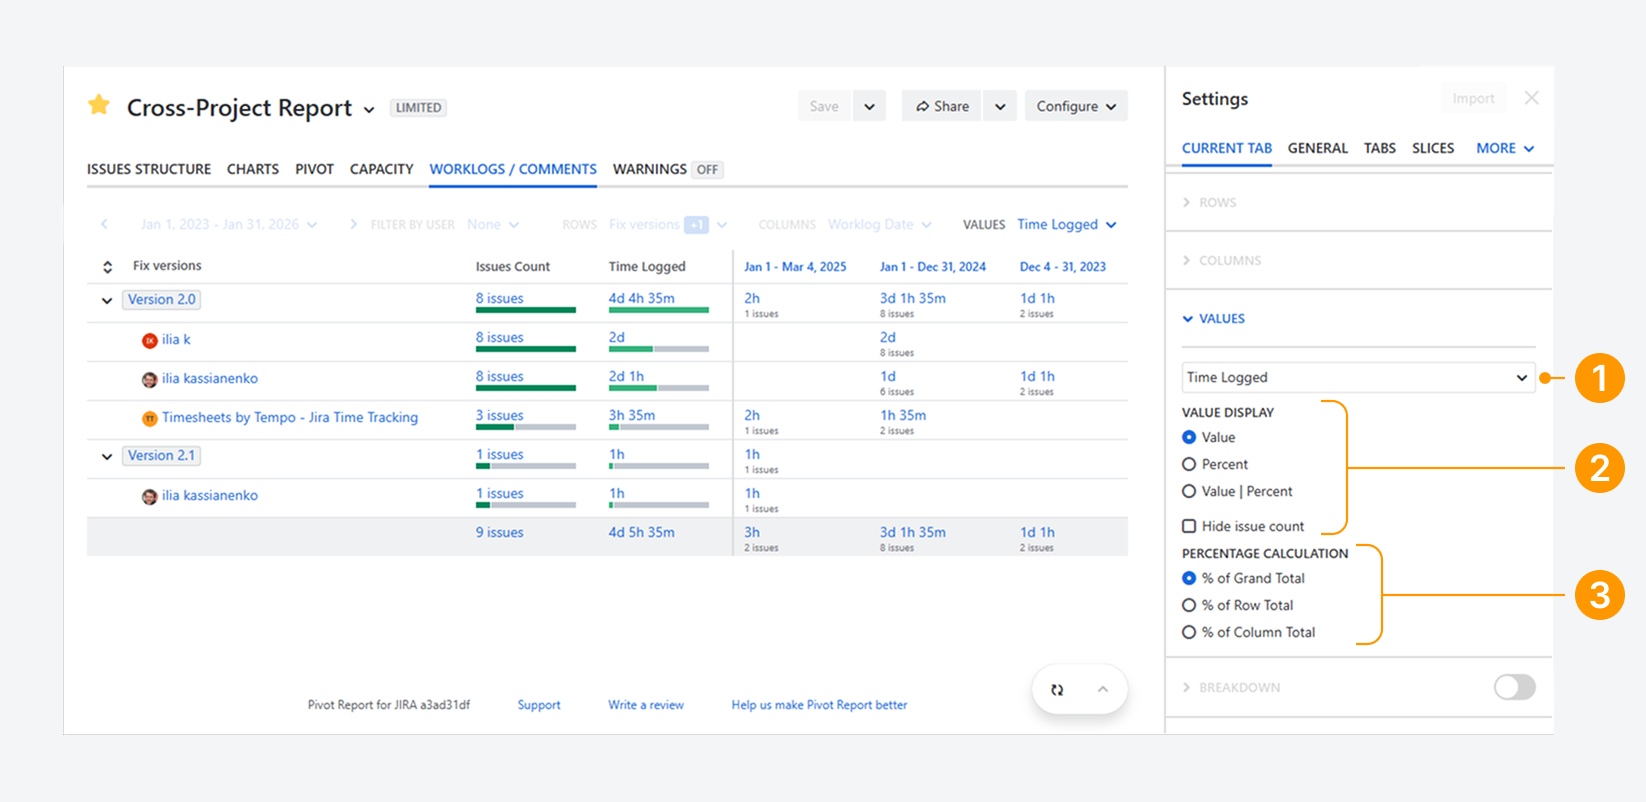
The options shown in the screenshot let you control the contents of each cell in the table created from rows and columns.
-
Select a value: Open the dropdown menu and choose the value to display in the table. In the Worklogs tab, the only available values are Time Logged and All Comments, which represents the total number of comments.
When the app is used with Jira Service Management, additional values become available: External, Internal, Agent, and Customer Comments. Each of these values shows the comment count for its category. By default, all customer comments are treated as external.
-
Choose how values are displayed: Decide whether the value appears as a number, as a percentage, or as a combined Value | Percent in the same cell. You can also choose to hide the issue count shown alongside the value.
-
Define percentage calculation: When using Percent or Value | Percent, specify how the percentage is calculated. Each cell can show a percentage based on the grand total of the table (all rows and columns), the row total, or the column total.
Interval
The options shown in the screenshot let you control the time period used for filtering.
-20260226-003945.png?cb=c4caca48ca00d5004f92a61316d14d31)
-
Start date: Select the start date of the interval using the calendar or by entering a date in the text box.
-
End date: Select the end date of the interval using the calendar or by entering a date in the text box.
-
Count: Defines the length of the interval. In the example, the interval spans two weeks. When start and end dates are set manually, this field is empty and not used.
-
Unit: Specifies the unit of time used with the count value, such as weeks in the example. When start and end dates are set manually, this field is empty and not used.
-
Offset: Determines whether the current time period is included or whether an offset is applied.
In the example, the current week is excluded and the interval is shifted back by one week, starting in the previous week relative to today. When start and end dates are set manually, this field is empty and not used.
-
Apply: Once you’ve made your changes to the interval, click Apply.
FAQ
Can you sort Issue count and Row Total columns?
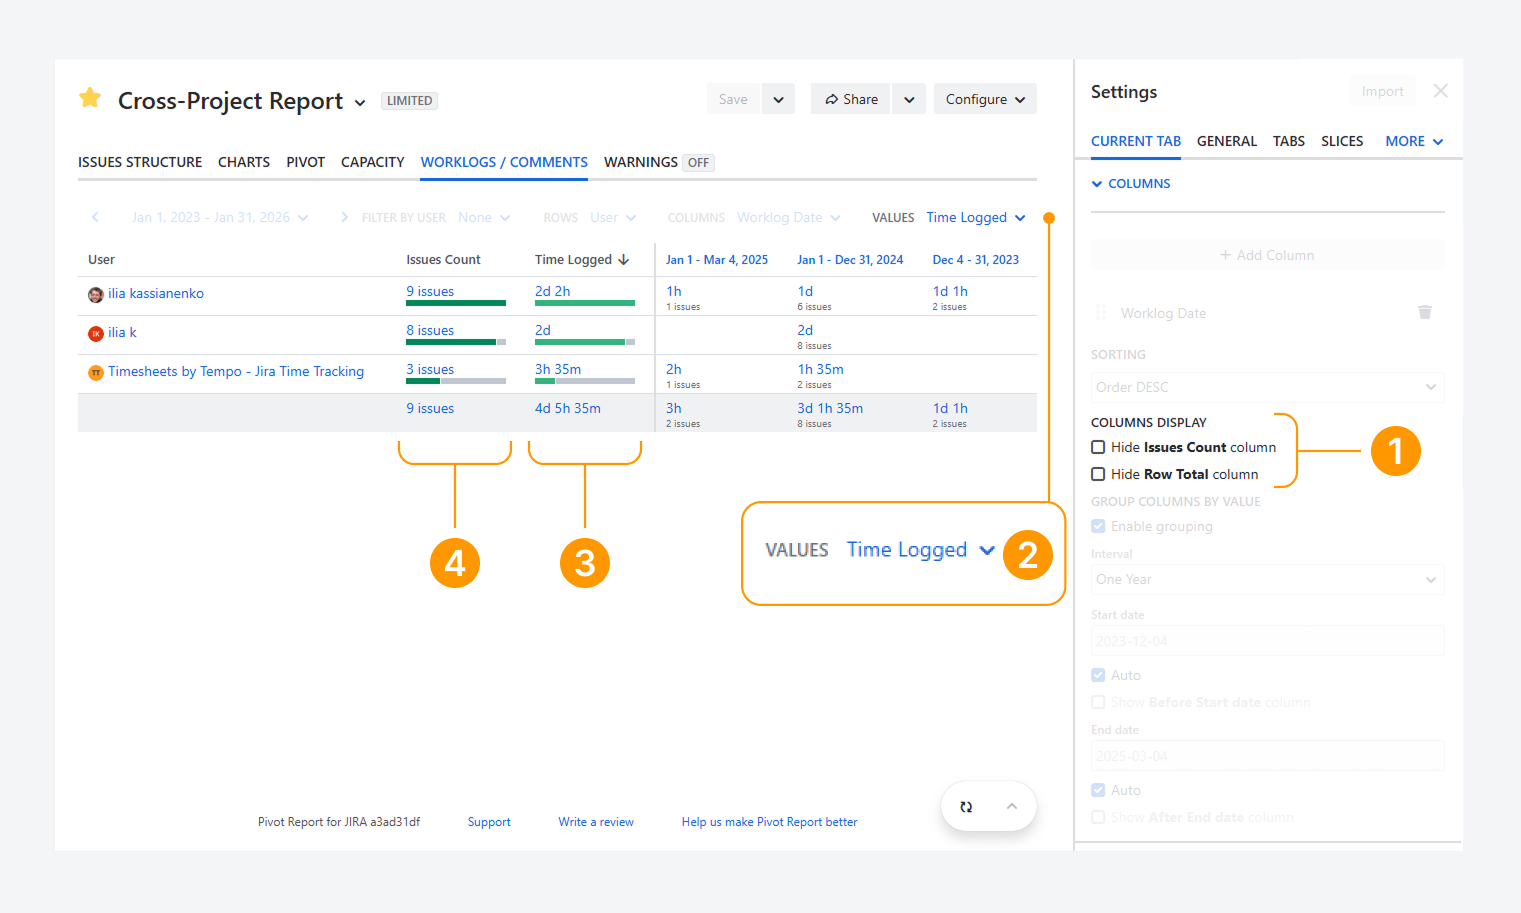
Yes. You can sort the Issue Count and Row Total columns in the Summary section by following these steps:
-
Open Column display options and choose whether to hide Issue count, row totals, or leave both visible.
-
In the Values dropdown, select the field you want to use for the Row Total column.
-
To sort the Row Total column, click its column header. In the example, Time Logged is sorted in descending order, indicated by a downward arrow (↓).
-
To sort the Issue Count column, click its column header. In the example, this column is not currently sorted.
Which empty rows can be hidden for all Slices?
-20260226-033629.png?cb=35f154c759e1651a53155597678cfd3d)
In the screenshot above, empty values for Sprint, Assignee, and Due Date appear in italic text, such as None and Unassigned, in their rows.
Any field that can be left blank in the Issue View—such as Label or Epic Link—can display an empty value. In contrast, fields that cannot be left blank under default Jira settings, such as Priority, will not show empty values.
To hide empty values and their rows, enable Hide rows with empty values (all slices) under Display options in the report sidebar’s Current tab settings. This setting applies to all slices, even when none are selected or displayed.
Can you change the appearance of worklogs in reports?
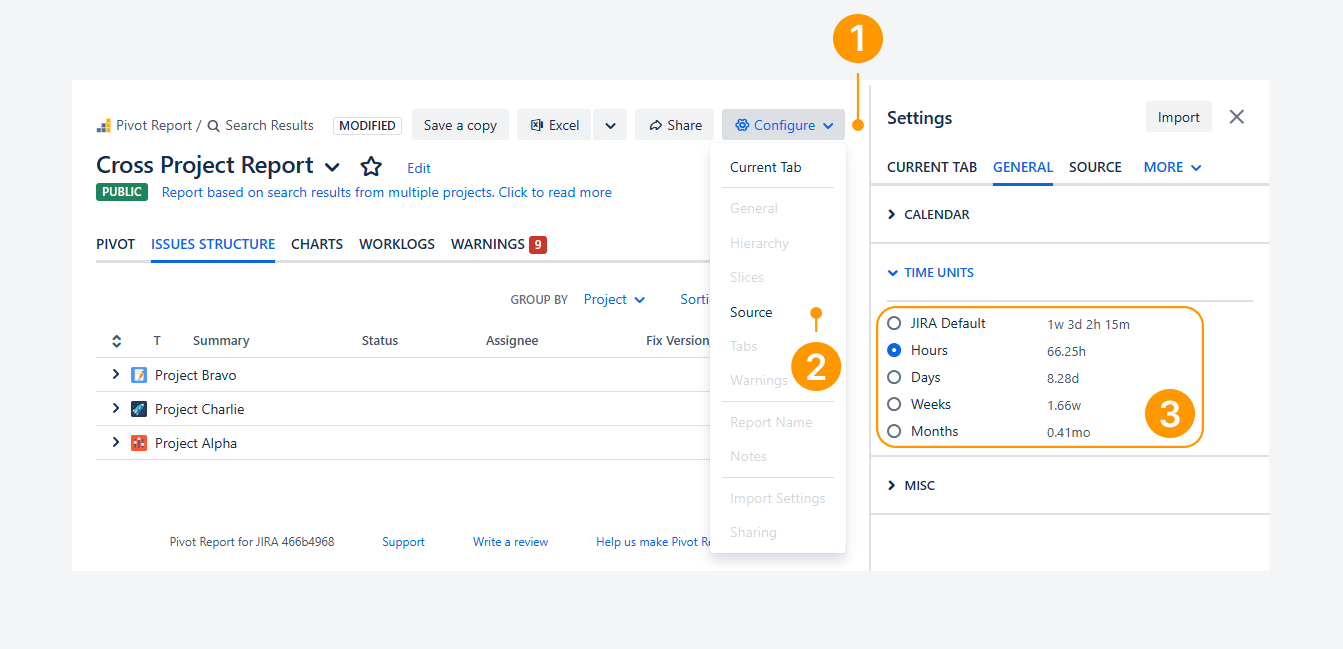
Yes. You can change how Time Logged appears by using the report sidebar.
For example, you can switch between Jira’s default time-tracking format (such as 1w 3d 2h 15m) or display values in hours, days, weeks, or months.
However, the appearance of the Worklog Date field is more limited. Even if you update the date and time format in Jira’s admin settings, the Worklog Date will still display in a fixed format (for example, Apr 8, 2026) without showing the time (AM/PM).
To modify how Time Logged appears from the report sidebar in Jira:
-
Click Configure in the header section.
-
Select General from the dropdown.
-
Go to the Time units section.
Can you hide Worklogs and Comments columns in the Breakdown section?
Worklog columns can be hidden in the Breakdown section, while Comment columns cannot.
-
Within the Summary section of this tab type, two Value options are available when the app is used in Jira: Time Logged (Worklogs) and All Comments (Comment count). The selected Value determines which columns appear in the Breakdown section when it is enabled.
-
When Time Logged is selected, the Breakdown section displays Worklog Date, Time Logged, and Worklog Comment by default. All three columns can be hidden.
In contrast, when All Comments is selected, the Breakdown section displays Comment and Comment Date. Neither of these columns can be hidden.
-20260623-200901.png?cb=5f77a245e80f66dfec3534e339d43933)
When the app is used in a Jira Service Management (JSM) project, additional Comment-based Value options are available, such as External Comments and Customer Comments, which are described in a related article.
For all of these additional Value options, the Comment and Comment Date columns cannot be hidden in the Breakdown section.
Troubleshooting
Can you lose access to the contents of the Worklogs tab type?
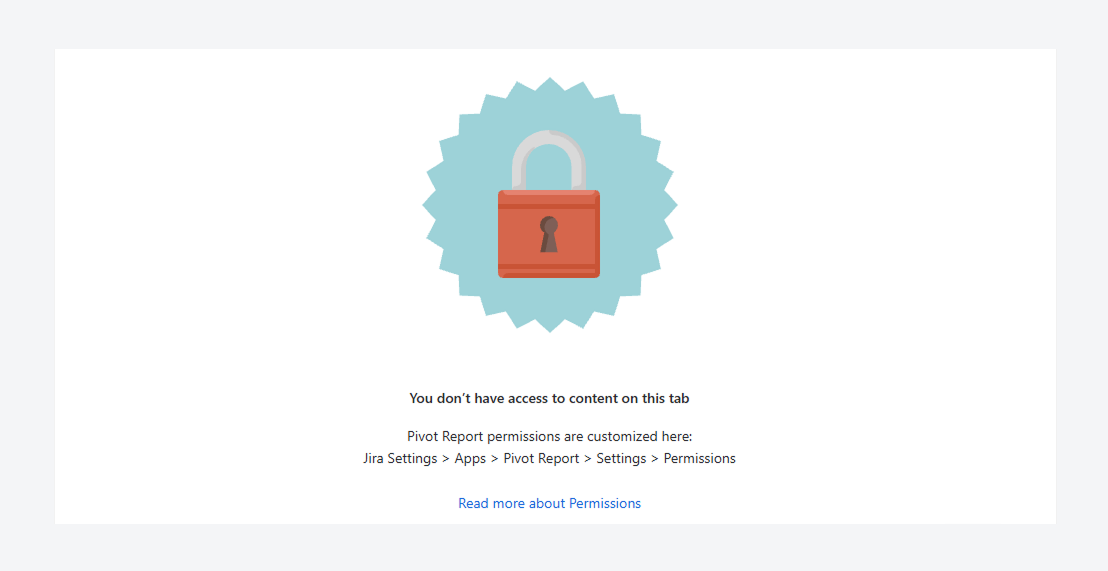
The error message above appears when the Worklogs tab type is hidden for all users or restricted to specific users. Users without access will see this message.
To restrict or restore access to the tab contents, follow the steps described in the related article.
This tab type is missing. Where can you find it?
-20260316-231536.png?cb=1414f6cd8f62ce6d6872ffcac17a2e3c)
If the Worklogs/Comments tab is missing, as shown in the screenshot above, it may have been removed from the report.
To add a tab, follow the steps in a separate article.
If you have questions or need assistance, contact our support team via email or service desk. Our team is available Monday through Friday (9:00 AM to 7:00 PM GMT+7) to help with technical challenges or discuss improvements.