

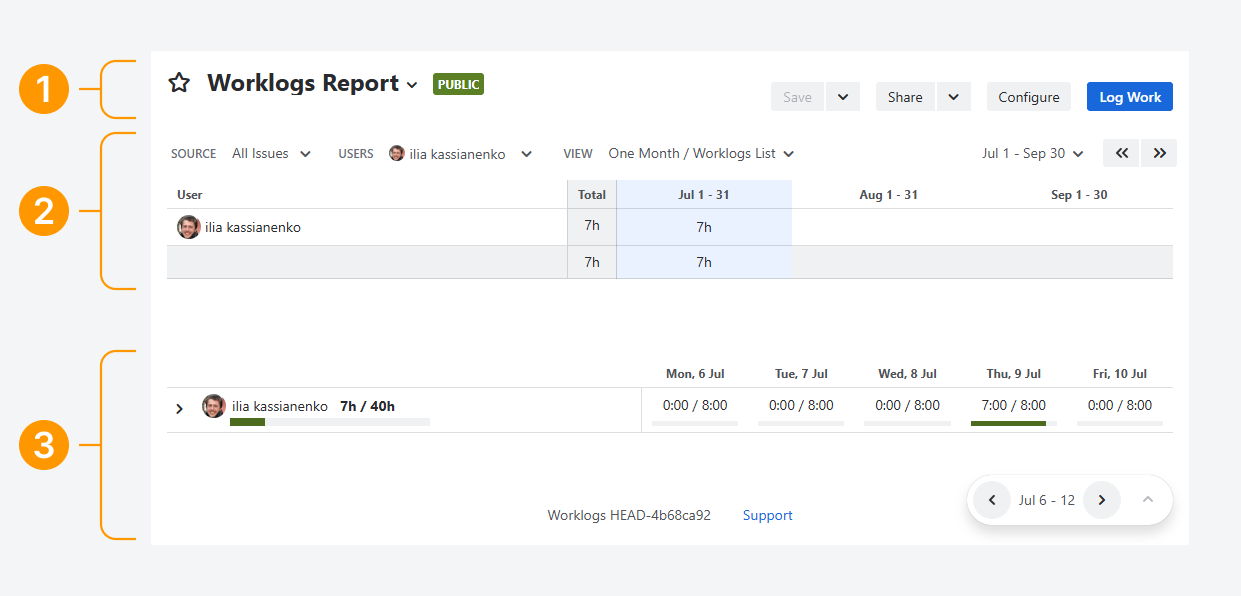
A report consists of three sections, which are shown in the screenshot above.
-
Header: Set the report’s description, sharing permissions, and configurations, and export its contents.
-
Summary: Set the report’s source, scope, interval, and appearance.
-
Breakdown: Detailed view of Worklogs, for each highlighted interval column in the Summary section.
Each section consists several interactable elements, which are detailed as follows.
Header
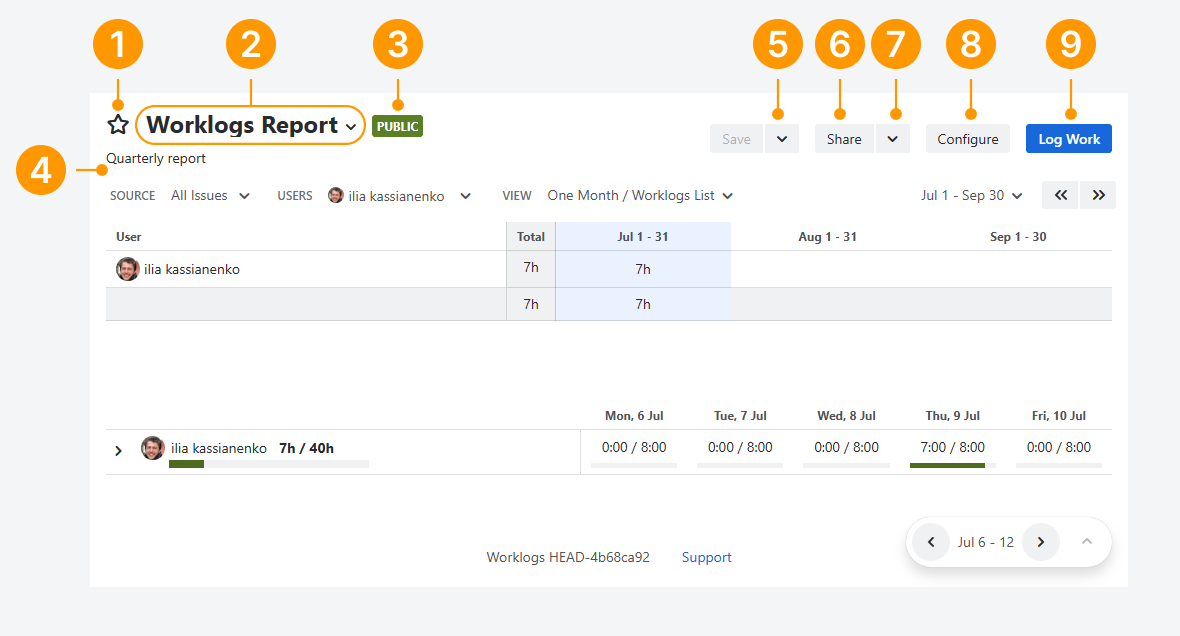
The Header section lets you share the report with other Jira users or export it to Excel for external users. It also provides quick access to your reports, linked pages or notes, and the report's settings.
The following elements are available in the Header section:
-
Favorite: Select the star icon to mark the report as a favorite, making it easier to find among your reports.
-
Name: View the report name and click the down arrow (⌄) to open a list of your most frequently used reports.
-
Sharing type: Displays a color-coded icon and text indicating the report's access permissions. In the screenshot above, a green square labeled Public is displayed.
Click the text to open the Sharing Settings pop-up. -
Description: View the report description.
-
Save a copy: Create an editable copy of the report.
-
Share: Copy the report's URL to the clipboard.
-
Excel: Export the report to a Microsoft Excel workbook. A separate article describes the exported fields.
-
Configure: Open the report configuration page, where you can manage permissions, rename the report, and modify other settings. These options are also available when creating a report, as explained in a related article.
-
Log Work: Add a worklog to a work item. A separate article describes the pop-up window that appears when logging time.
Summary
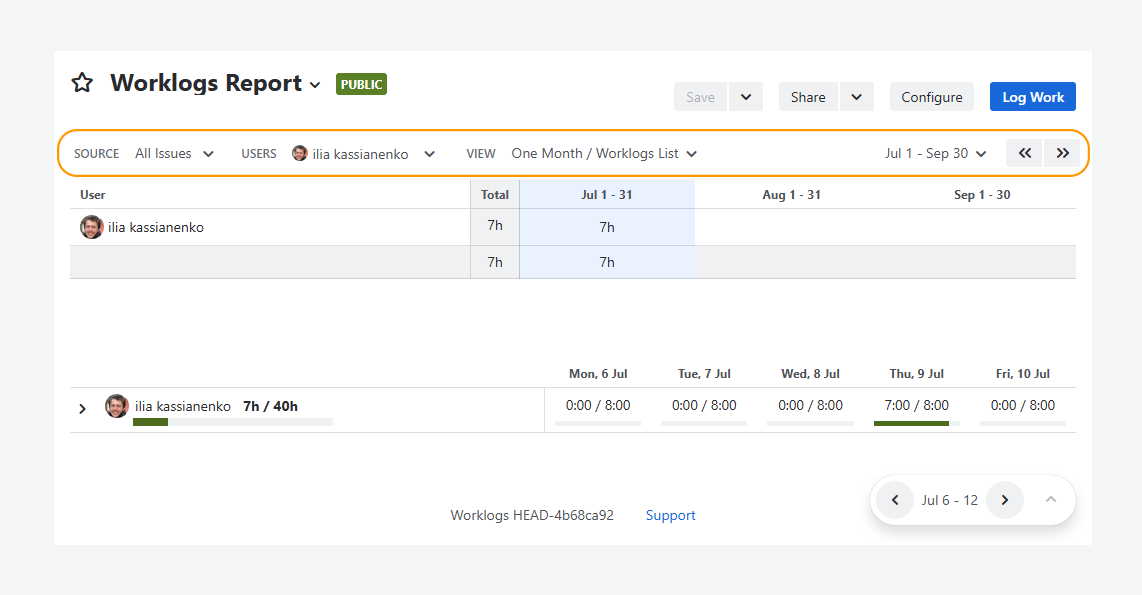
The Sources section defines which issues, users, and time period are included in the report.
Source
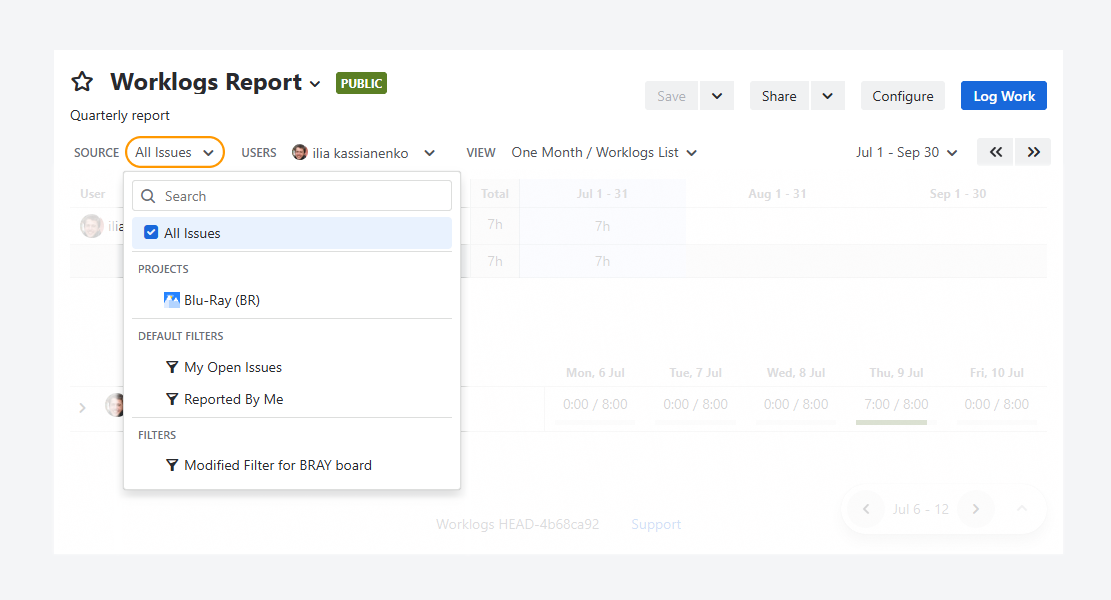
The screenshot above shows a report that uses All Issues as its source. This is the default source for new reports.
In the drop down, select the spaces and filters to use as report sources. You can use work items created by or assigned to you by selecting Default filters. You can also use public or private filters.
Users
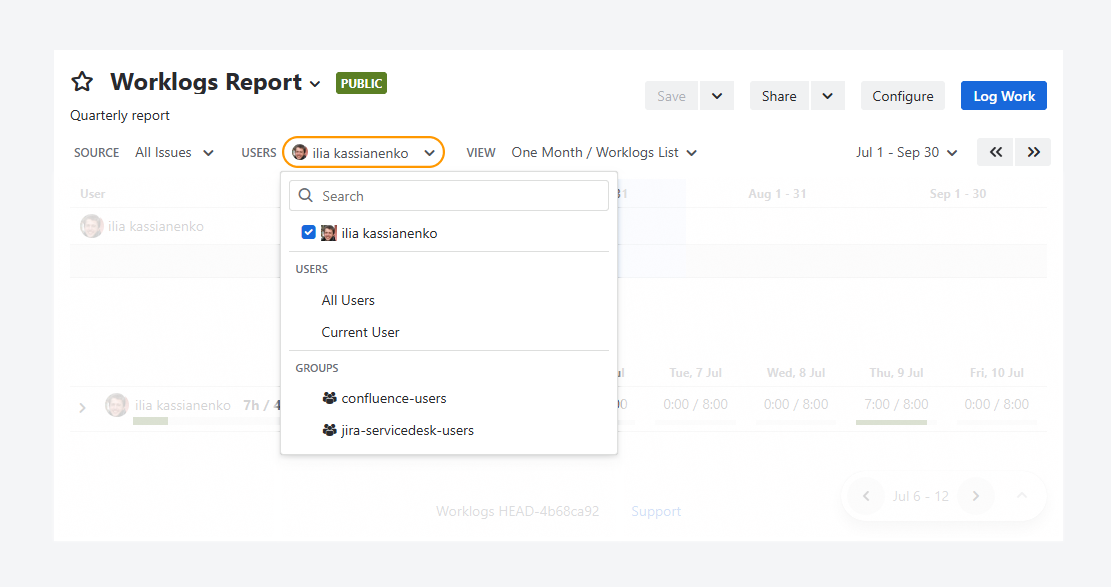
The screenshot above a single user selected.
In the dropdown, select the users and groups that will appear in the report. If you leave this field empty, the report will show worklogs for all users.
View
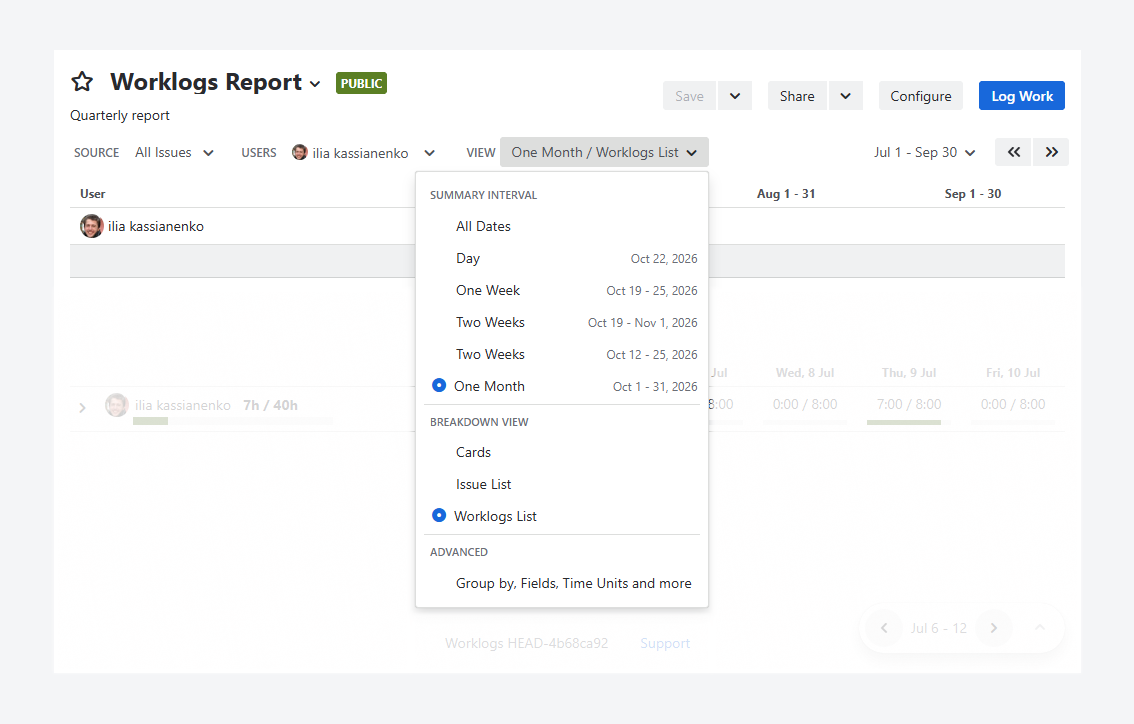
The screenshot above shows a monthly interval for the Summary section and Worklogs List for the Breakdown section.
In the dropdown, select the interval to display in the Summary section, such as daily, weekly, biweekly, or monthly. In the example above, each column represents one month: Aug 1–31 and Sep 1–30.
You can also choose how to display the Breakdown section: Cards, Issue List, or Worklogs List.
Interval
The options shown in the screenshot let you control the time period used for filtering.
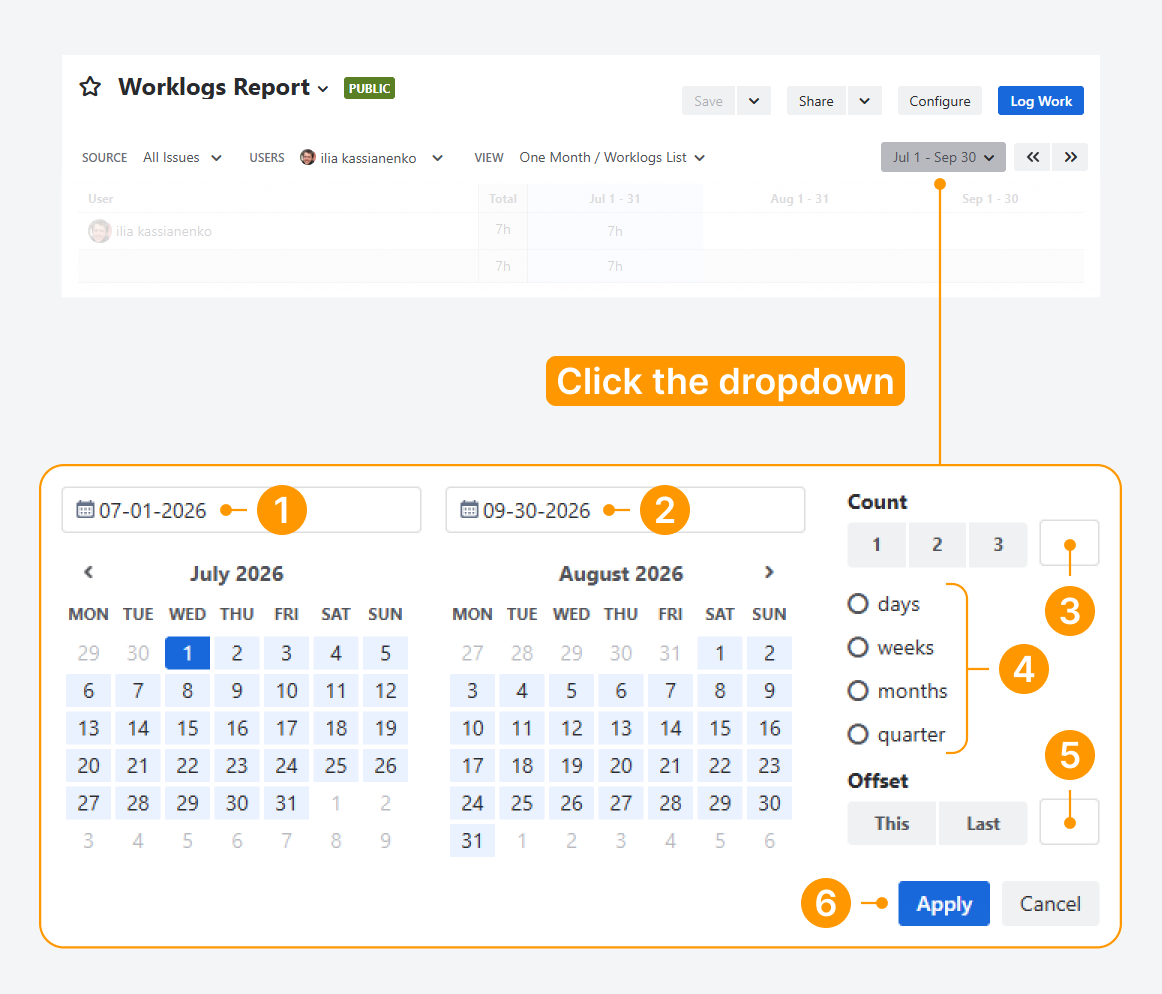
-
Start date: Select the start date of the interval using the calendar or by entering a date in the text box.
-
End date: Select the end date of the interval using the calendar or by entering a date in the text box.
-
Count: Defines the length of the interval. In the example, the interval spans two weeks. When start and end dates are set manually, this field is empty and not used.
-
Unit: Specifies the unit of time used with the count value, such as weeks in the example. When start and end dates are set manually, this field is empty and not used.
-
Offset: Determines whether the current time period is included or whether an offset is applied.
In the example, the current week is excluded and the interval is shifted back by one week, starting in the previous week relative to today. When start and end dates are set manually, this field is empty and not used.
-
Apply: Once you’ve made your changes to the interval, click Apply.
Breakdown
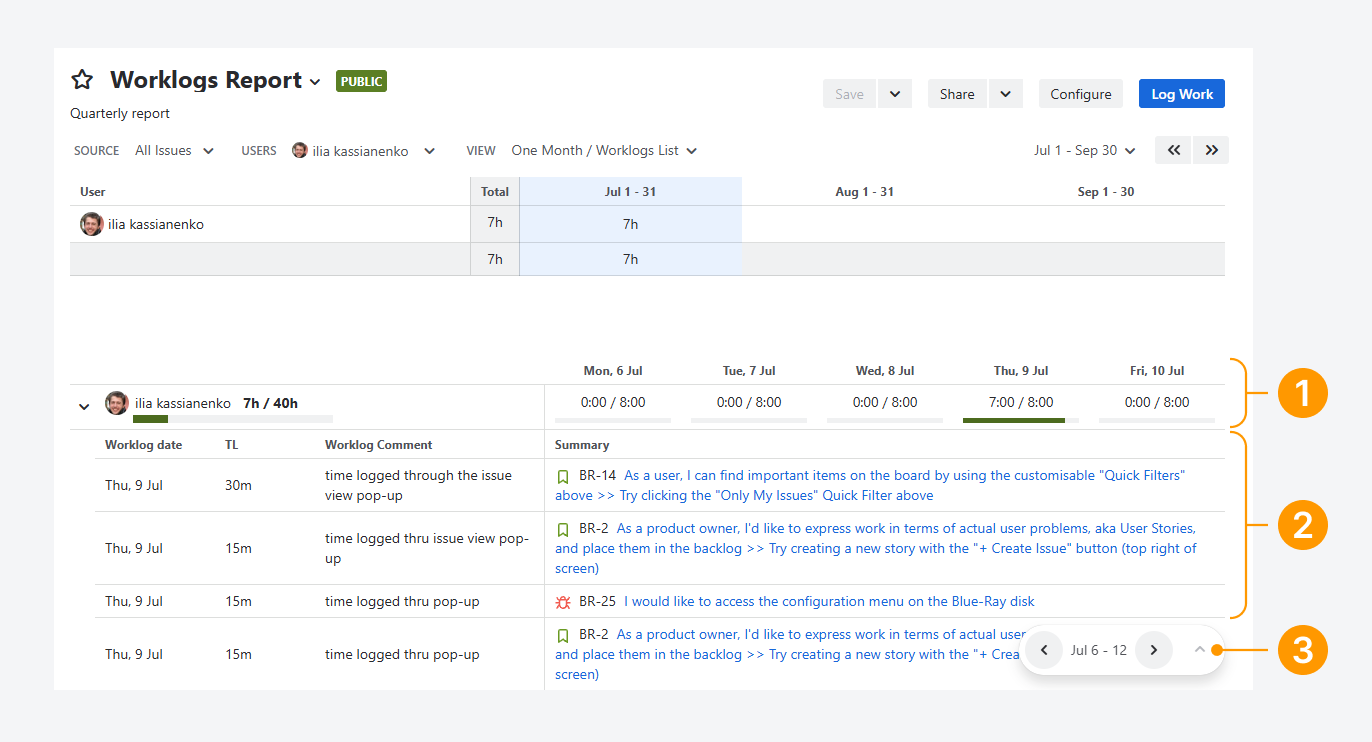
In the screenshot above, the Breakdown section uses the Worklogs List view and displays the selected interval, July 1–31.
The Breakdown section contains three subsections:
-
Daily logged time: Shows the time logged for each day. In the Issue List and Worklogs List views, you can expand the table by clicking any element in a row.
In the example, the first row shows 7 hours logged on a Thursday against a daily target of 8 hours. The other columns show missing time entries for the remaining workdays. -
Detailed logs: In the Issue List and Worklogs List views, this subsection shows the issue Summary, Worklog Date, and Time Logged for each issue with logged time.
-
Weekly navigation: Use the forward and backward arrows to navigate between weeks within the selected interval.
In the example, you can use the arrows to view other weeks in the Jul 1–Sept 30 interval. Only the detailed logs for July 6–12 are visible in the screenshot.
In addition to providing a more detailed view of the Summary section, the Breakdown section lets you display additional Jira system fields, app-specific fields, and custom fields for each worklog.
To edit the contents of the Breakdown section or add fields to other report sections, see the related article.
FAQ
Troubleshooting
If you have questions or need assistance, contact our support team via email or service desk. Our team is available Monday through Friday (9:00 AM to 7:00 PM GMT+7) to help with technical challenges or discuss improvements.