
Hey there,
It’s been a while, but now we’re back with a significant update that we believe deserves its own dedicated article. We’ve been hard at work to enhance your experience, and we can’t wait to share the exciting improvements with you.
New User Experience for Report configuration
Before the October 2023 update, configuring tabs was less user-friendly. The field configuration pop-up had limited functionality, lacked real-time updates, and its constrained space made adding new options more difficult.
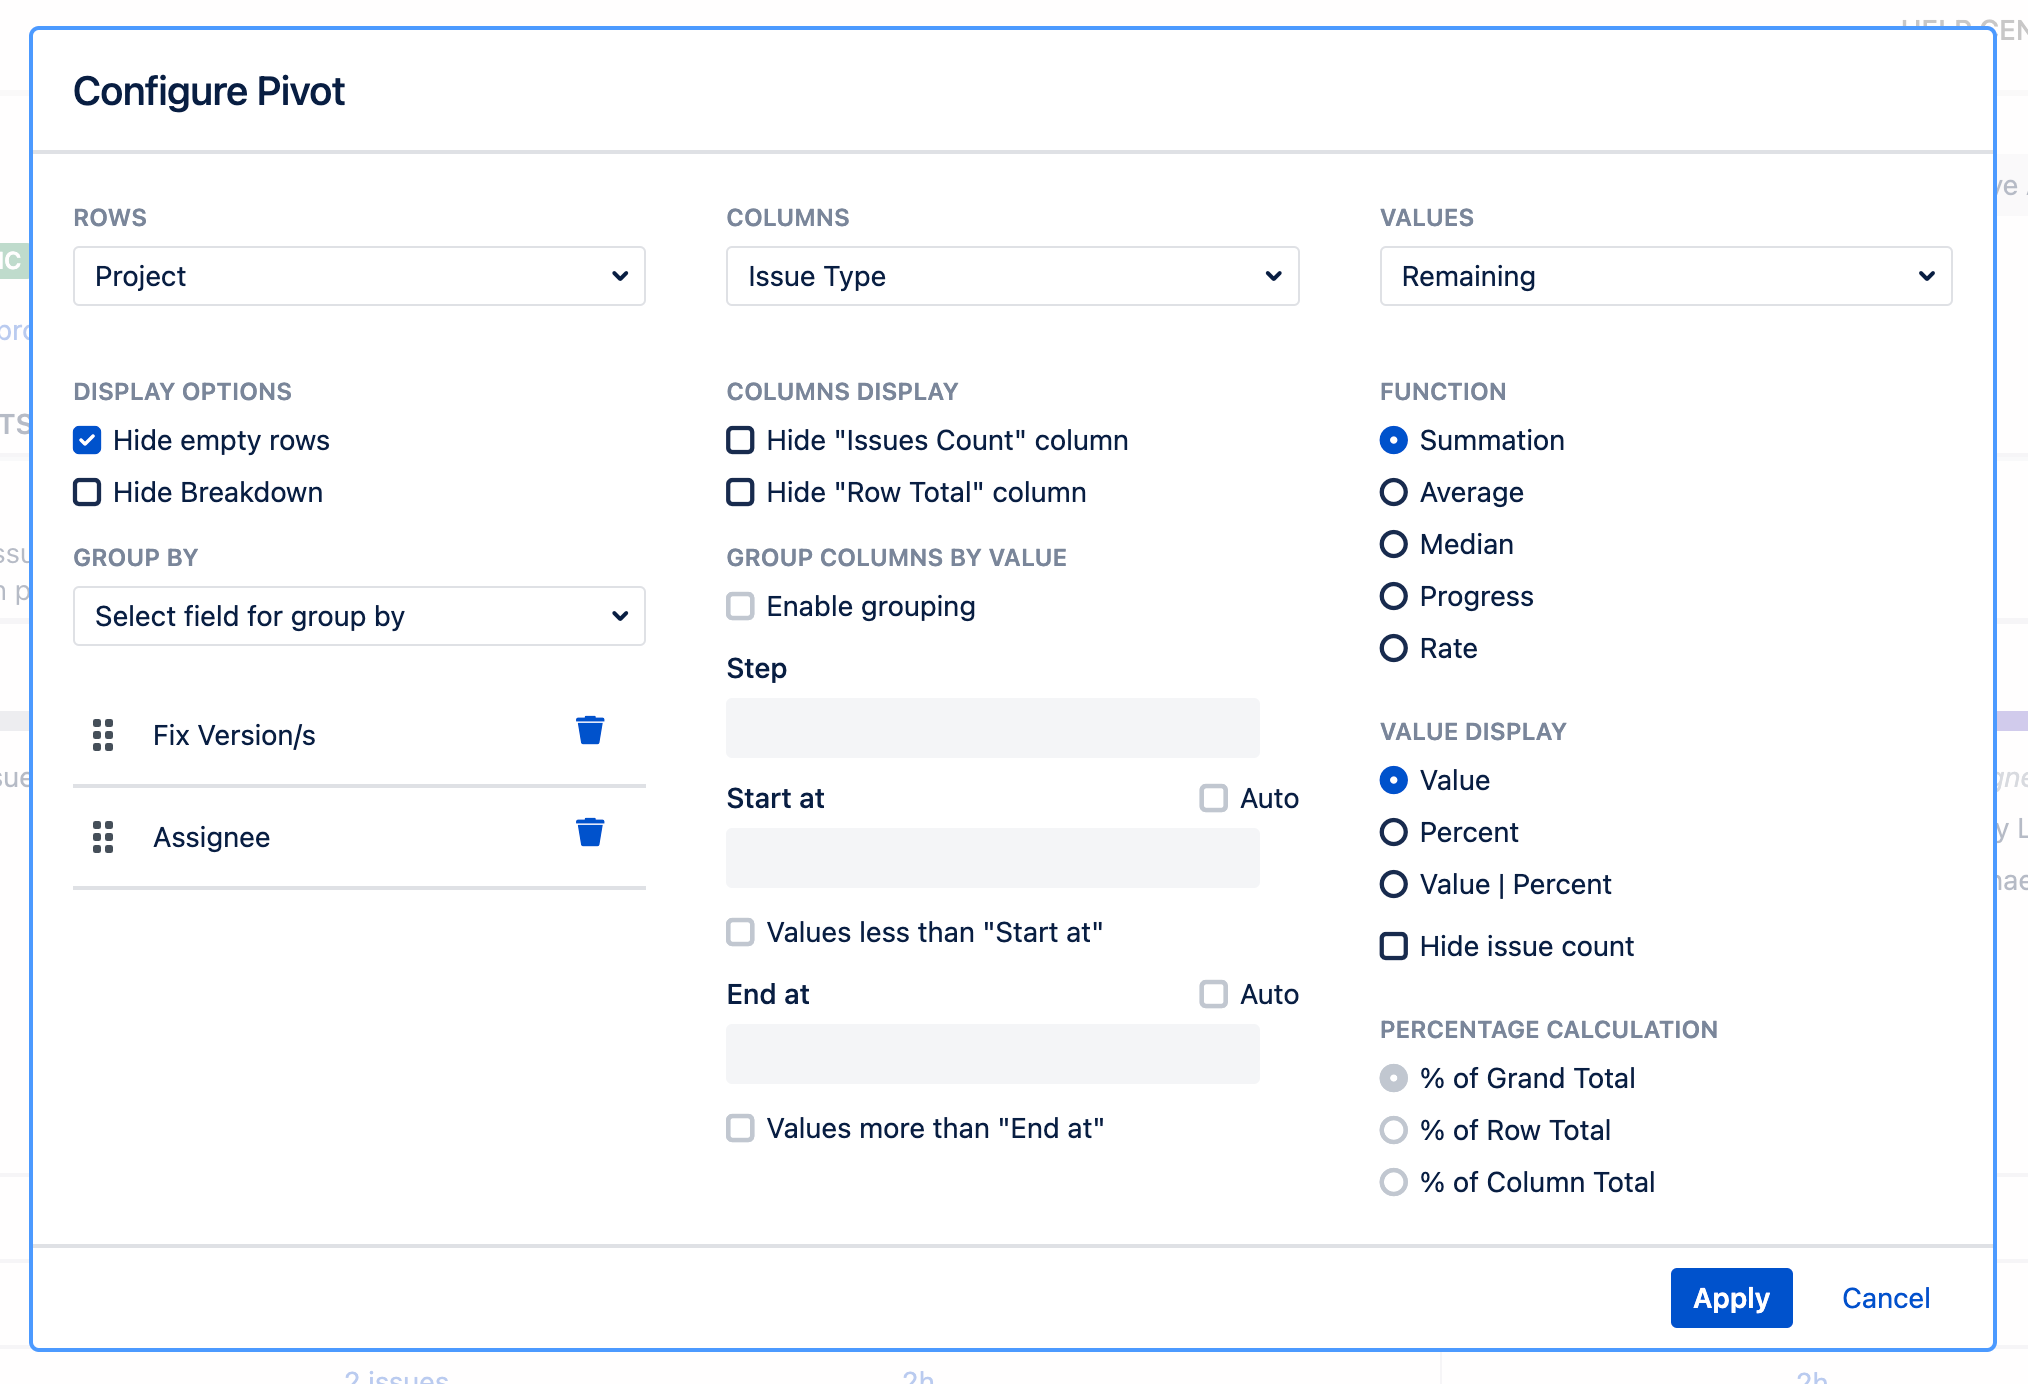
After some extensive internal discussions, we decided to revamp this experience by introducing a side panel.
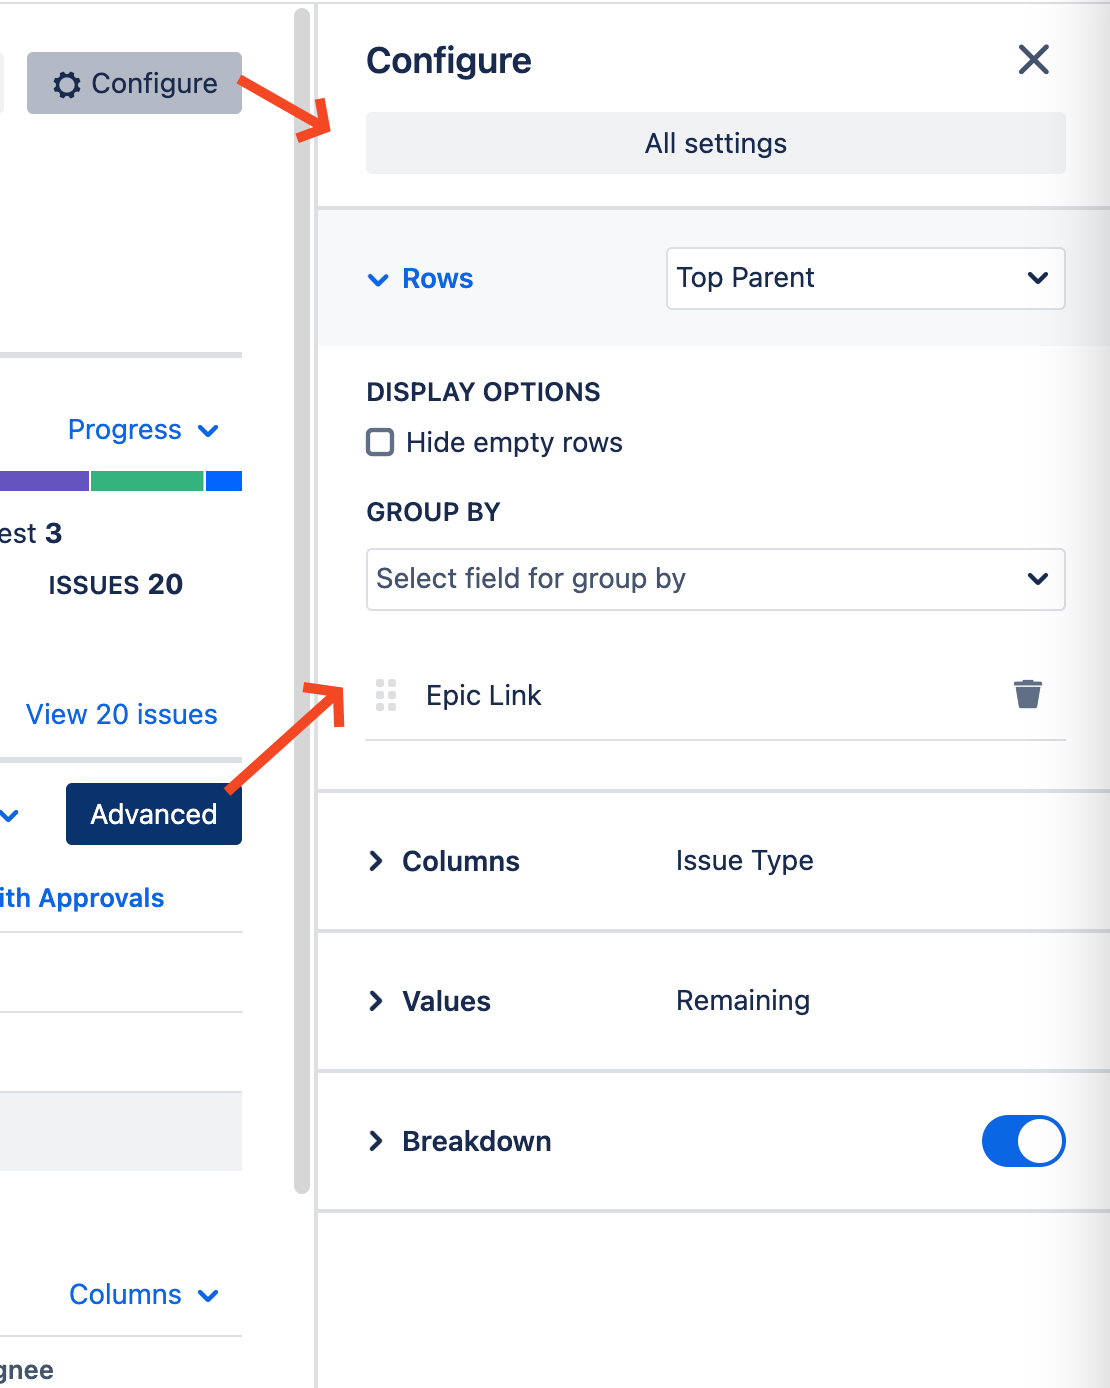
As a user, you can now witness changes as they happen, and as developers, we’re no longer boxed in by a window’s size. The side panel is not only more dynamic but also neatly organized into collapsible sections.
The window is now replaced by a Settings right-hand sidebar, allowing you to observe changes to your report in real-time.
Moreover, this sidebar includes collapsible sections like Rows, Columns, Values, etc.
We can’t spill the beans on why we need this extra space just yet, but rest assured, more options are on their way to make Pivot Report even better =)
Breakdown in a separate pop-up
Since day one, our layout included a Summary section with a breakdown for each row displayed beneath it. However, as the Pivot tab grew more intricate, having all elements on a single page no longer sufficed—especially with row grouping enabled.
-
Exploring specific work items within the Summary section without leaving the report wasn’t possible.
-
Similarly, Progress indicators and Charts had clickable elements in the legend that opened Jira’s Issue Navigator in a new browser tab. While functional, it lacked the convenience of staying within the same window.
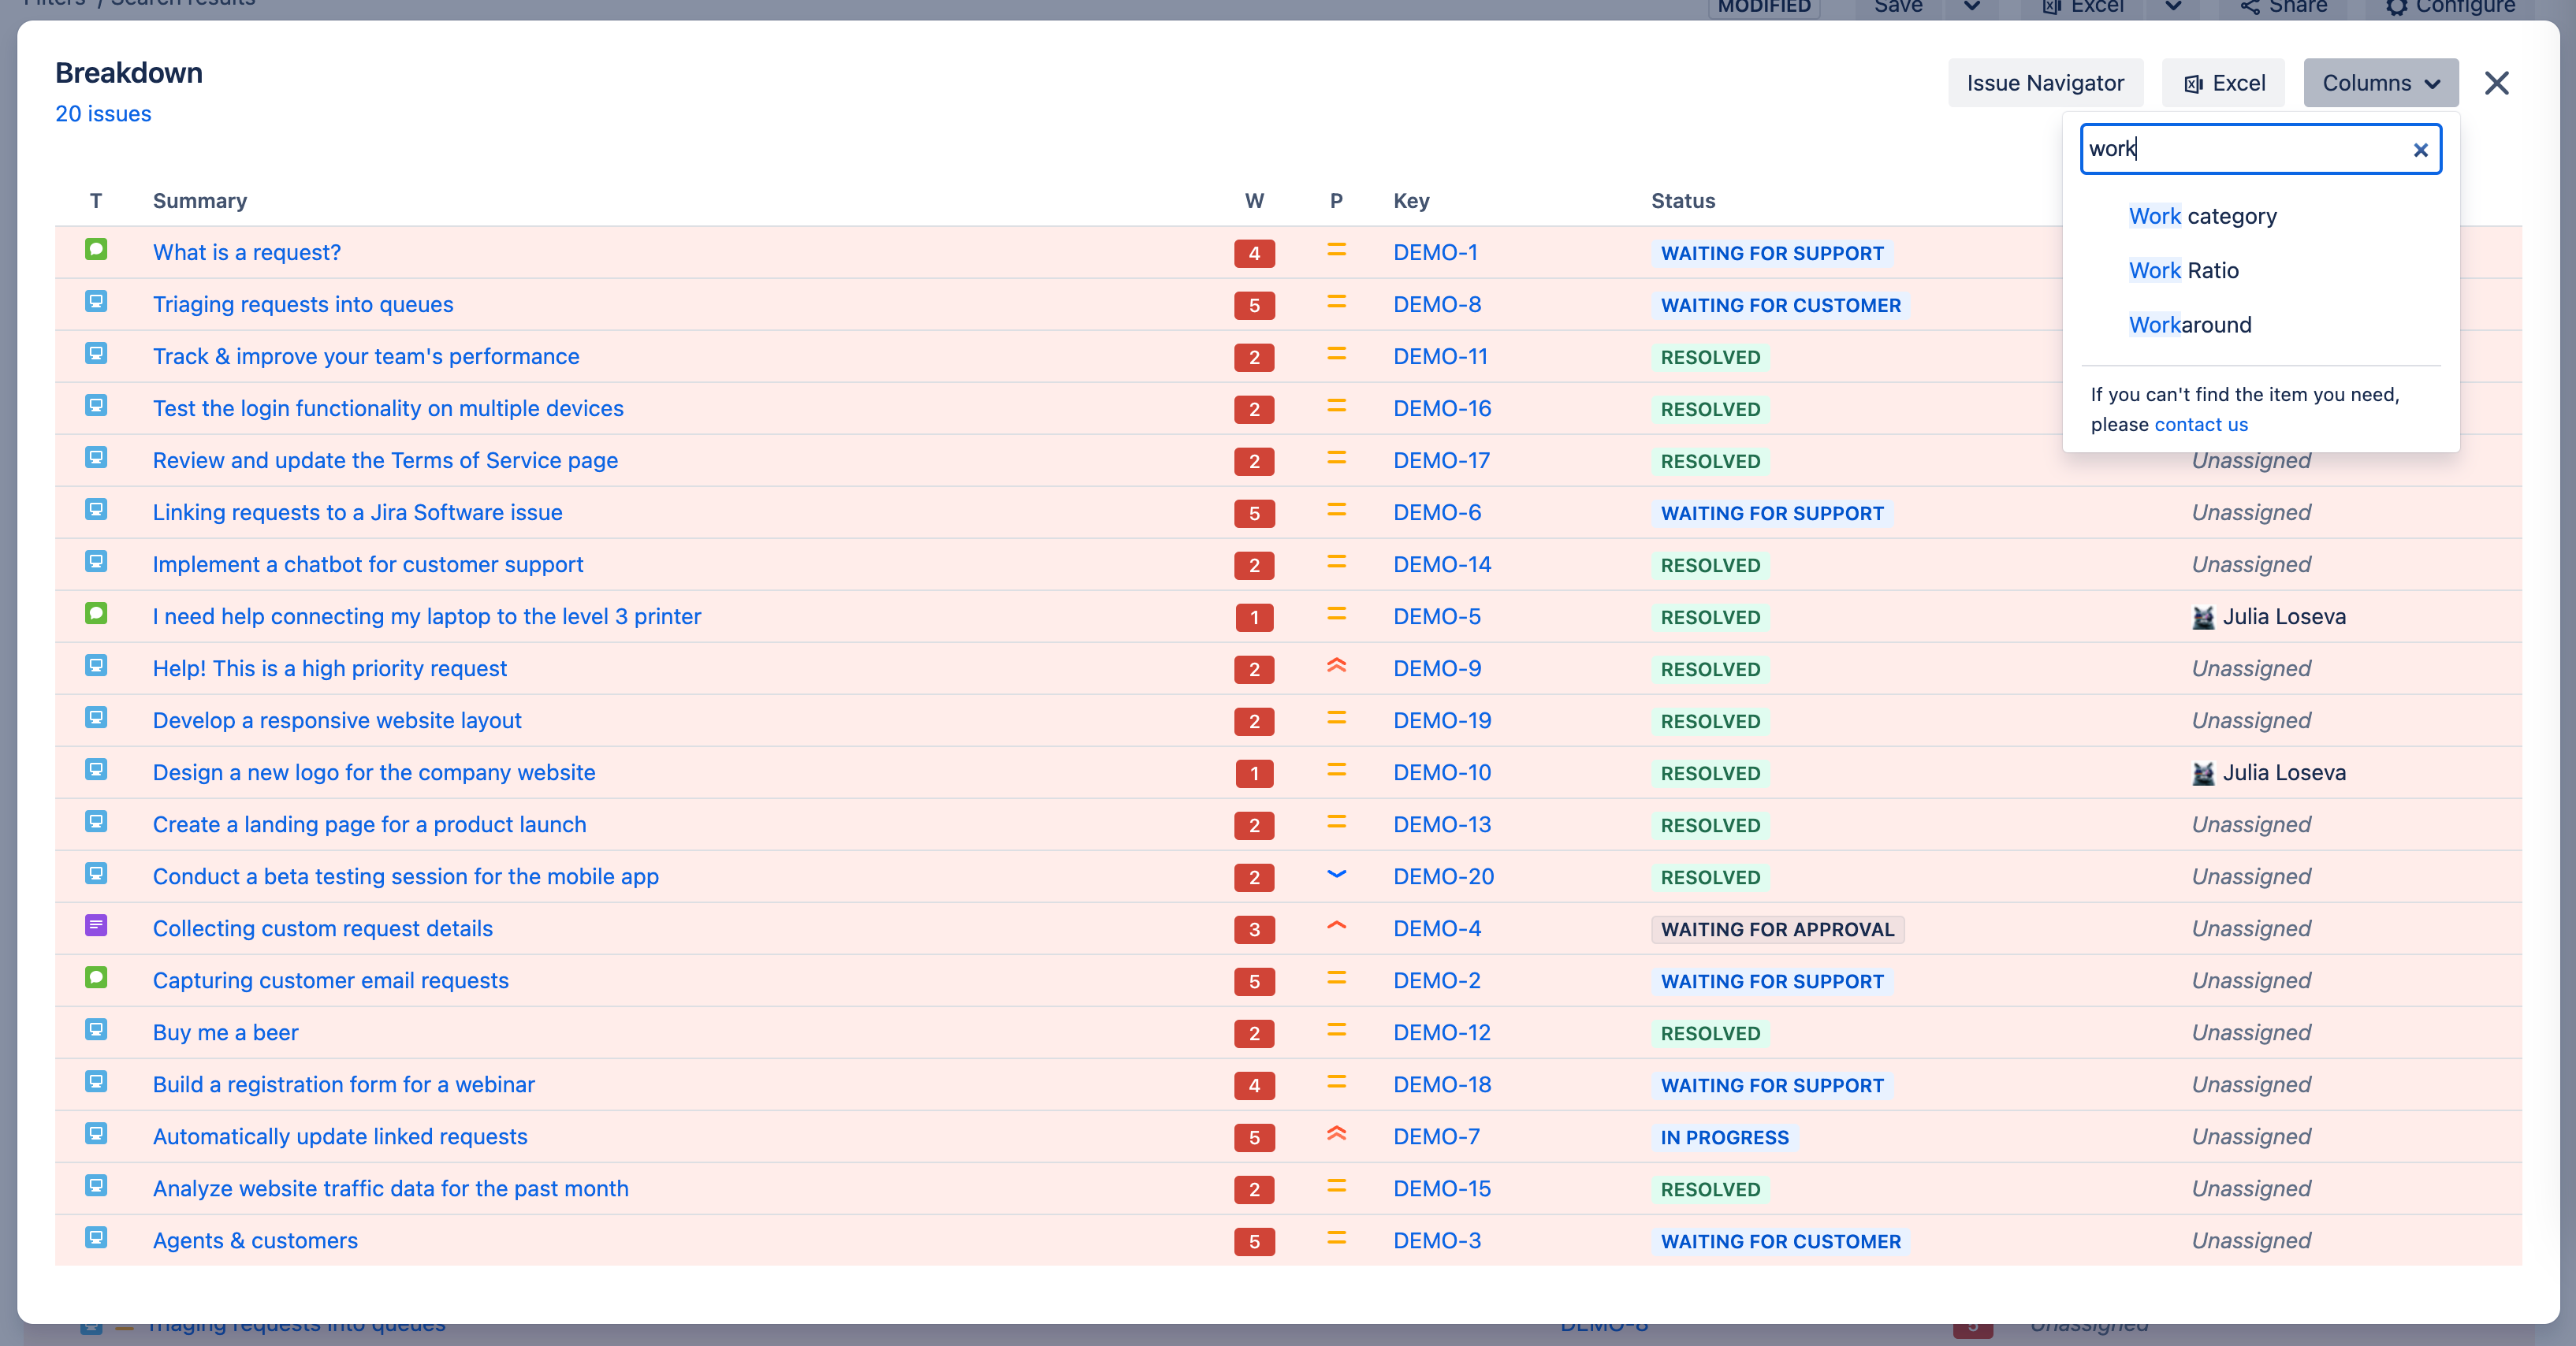
After brainstorming, we introduced a custom pop-up to streamline work item exploration.
Supported features
This pop-up works like the Issue Navigator but offers additional functionality. You can include Pivot Report-specific columns, such as Overspent, Underspent, Work Ratio, and Completion Rate, which aren’t available outside Pivot Report.
The best part: you can stay within the same report window, avoiding the need to switch to a different browser tab and interface.
Clickable report elements
Across various tabs, numerous clickable elements are available, including legend items, Progress indicator bars, Charts, and cells in the Summary section, such as sub-totals and headers.
Clicking any of these elements opens a pop-up showing their breakdown.
Clickable dashboard widgets
The prior functionality also extends to Dashboard widgets. Clicking an element within a widget directs you to a detailed view of its Breakdown. From there, you can access the original report through a link in the header.
Disabling breakdown
The Work items breakdown pop-up doesn't replace the Breakdown section beneath the Summary section.
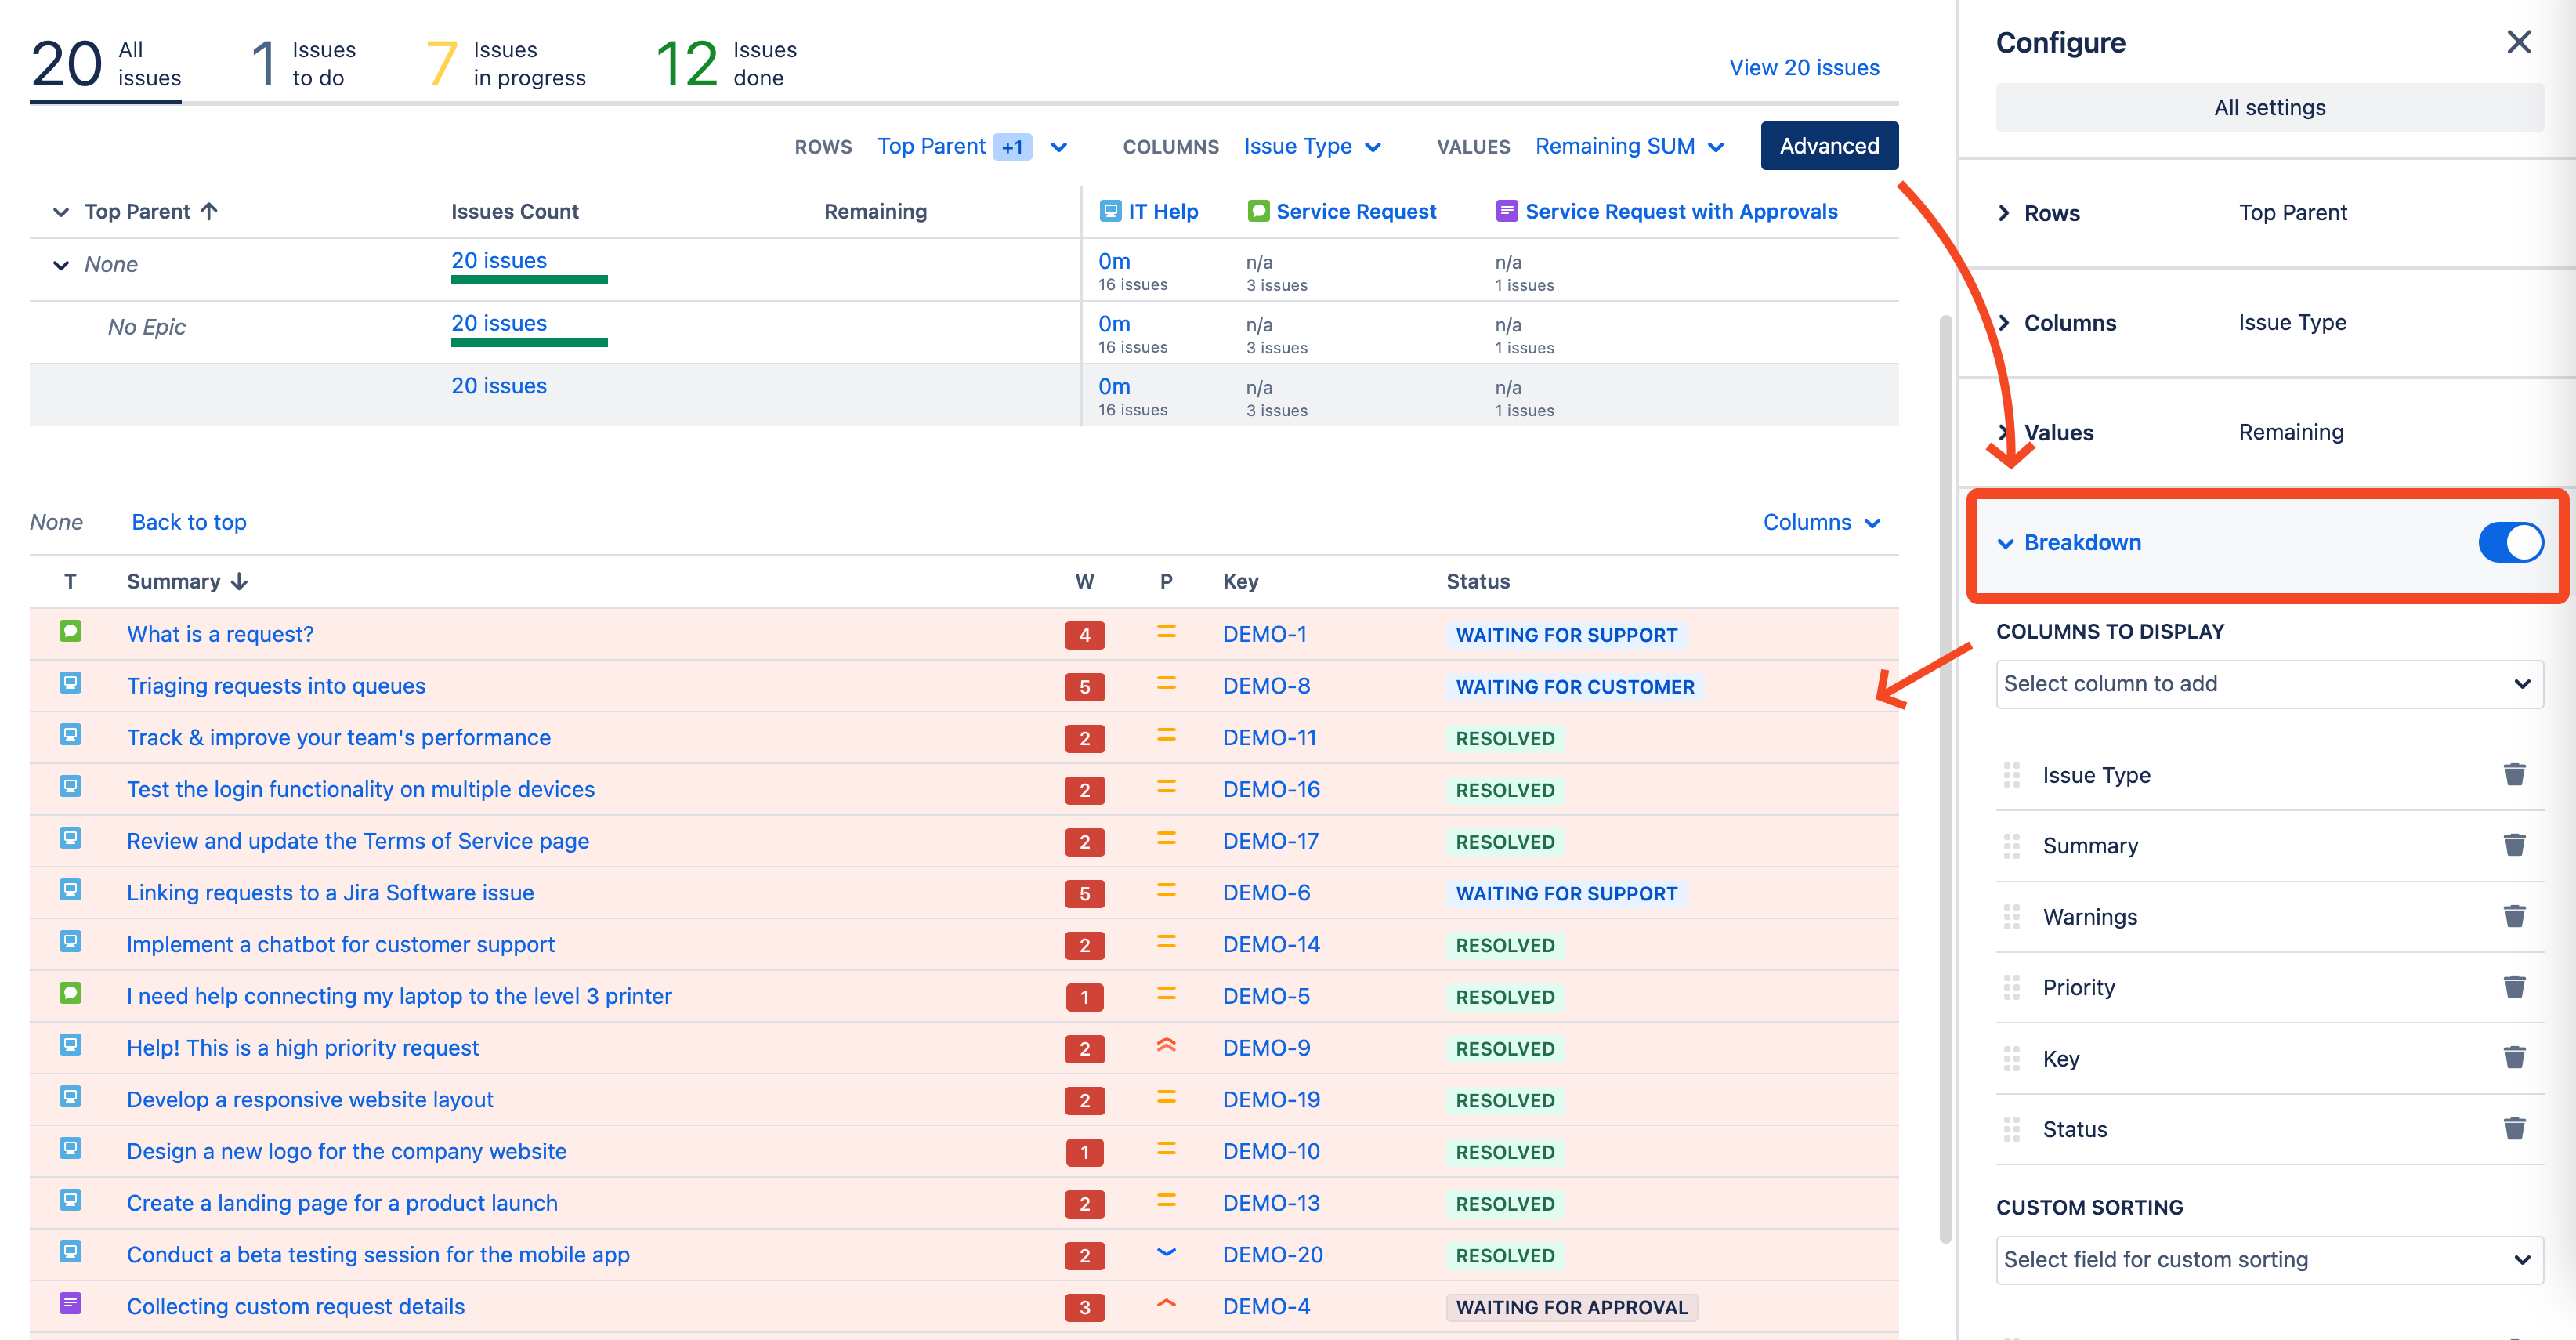
To enable this feature, click the Advanced button as shown in the screenshot below.
Next, go to the collapsible Breakdown field. Ensure the icon is blue, indicating the section is enabled. If the icon is gray, the section is currently disabled.
Work item View pop-up (Cloud)
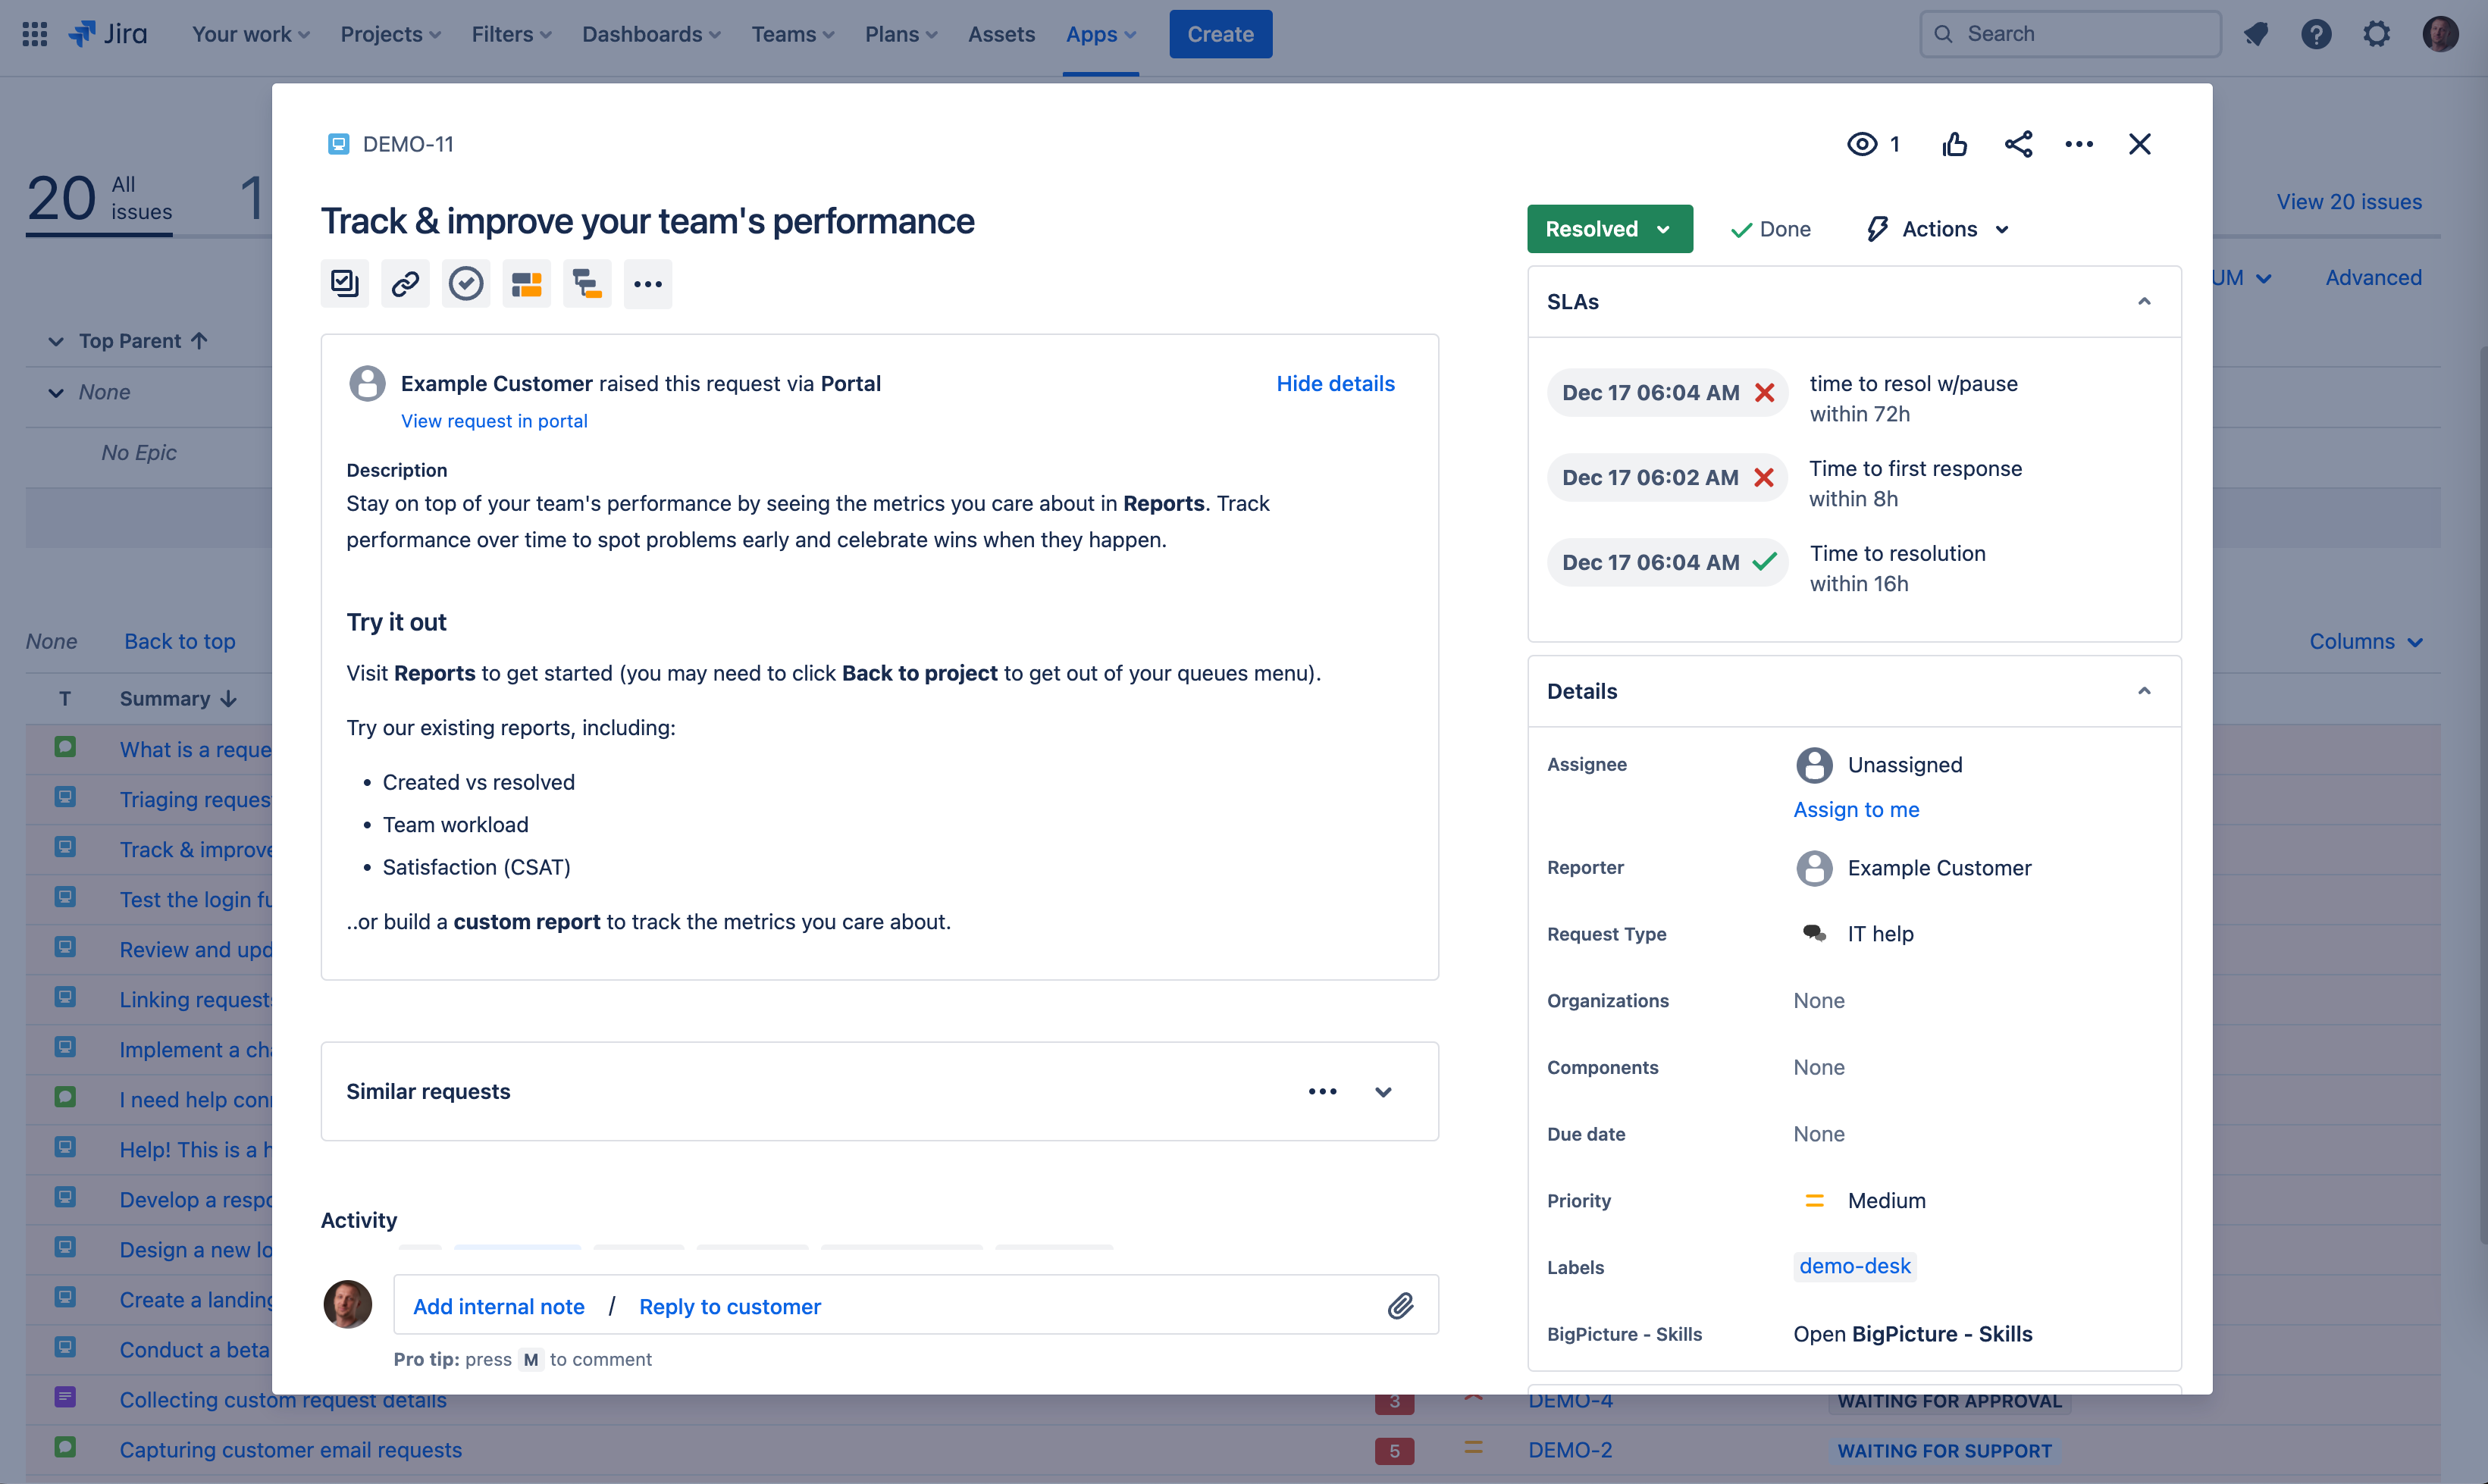
In addition to the new Breakdown feature, we now offer an Work item View pop-up on Jira Cloud. This pop-up supports custom fields, view settings, widgets, and more.
It works similarly to the Work item View pop-up on Scrum and Kanban Boards, where clicking on any work item opens a pop-up with an editable Work item View.
Accessing the pop-up
You can access this pop-up by clicking any row in the Breakdown pop-up or section. In the Work item Structure tab, selecting a row in the Summary section also opens the Work item View pop-up.
With appropriate Jira permissions set by an admin, you can directly edit work items within the Work item View pop-up.
Change notification
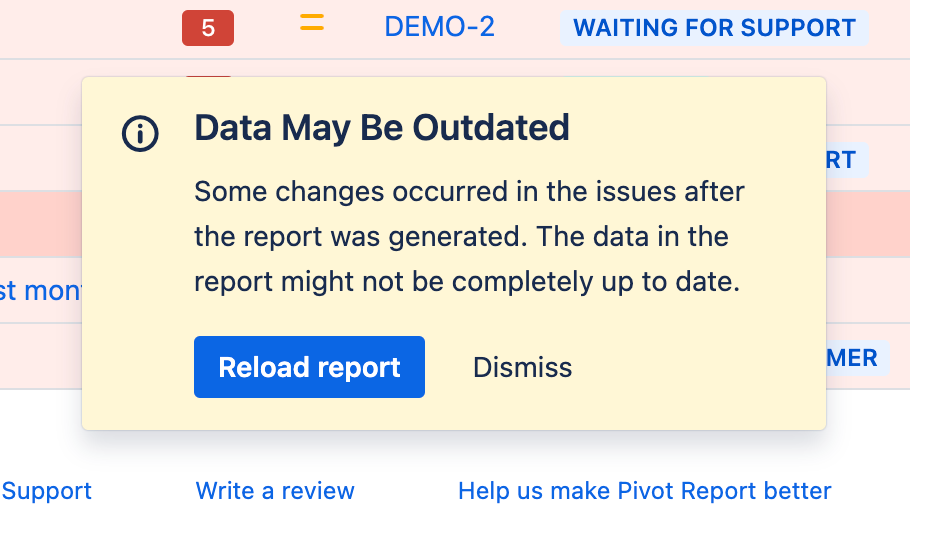
Changes made within the pop-up, such as editing an work item's Summary or Original estimate, will not automatically update in the source Pivot report.
After making changes, a notification appears in the bottom-right corner of the report, informing you about the modifications, as shown in the provided screenshot.
Click Reload Report to apply these changes and continue working with the updated report.
Future development
As part of future development, we aim to offer additional support for displaying changes. Currently, a notification system is in place. The report does not automatically reload to prevent potential disruptions caused by applying a single change to a specific work item.
Two levels for Columns for Pivot tab
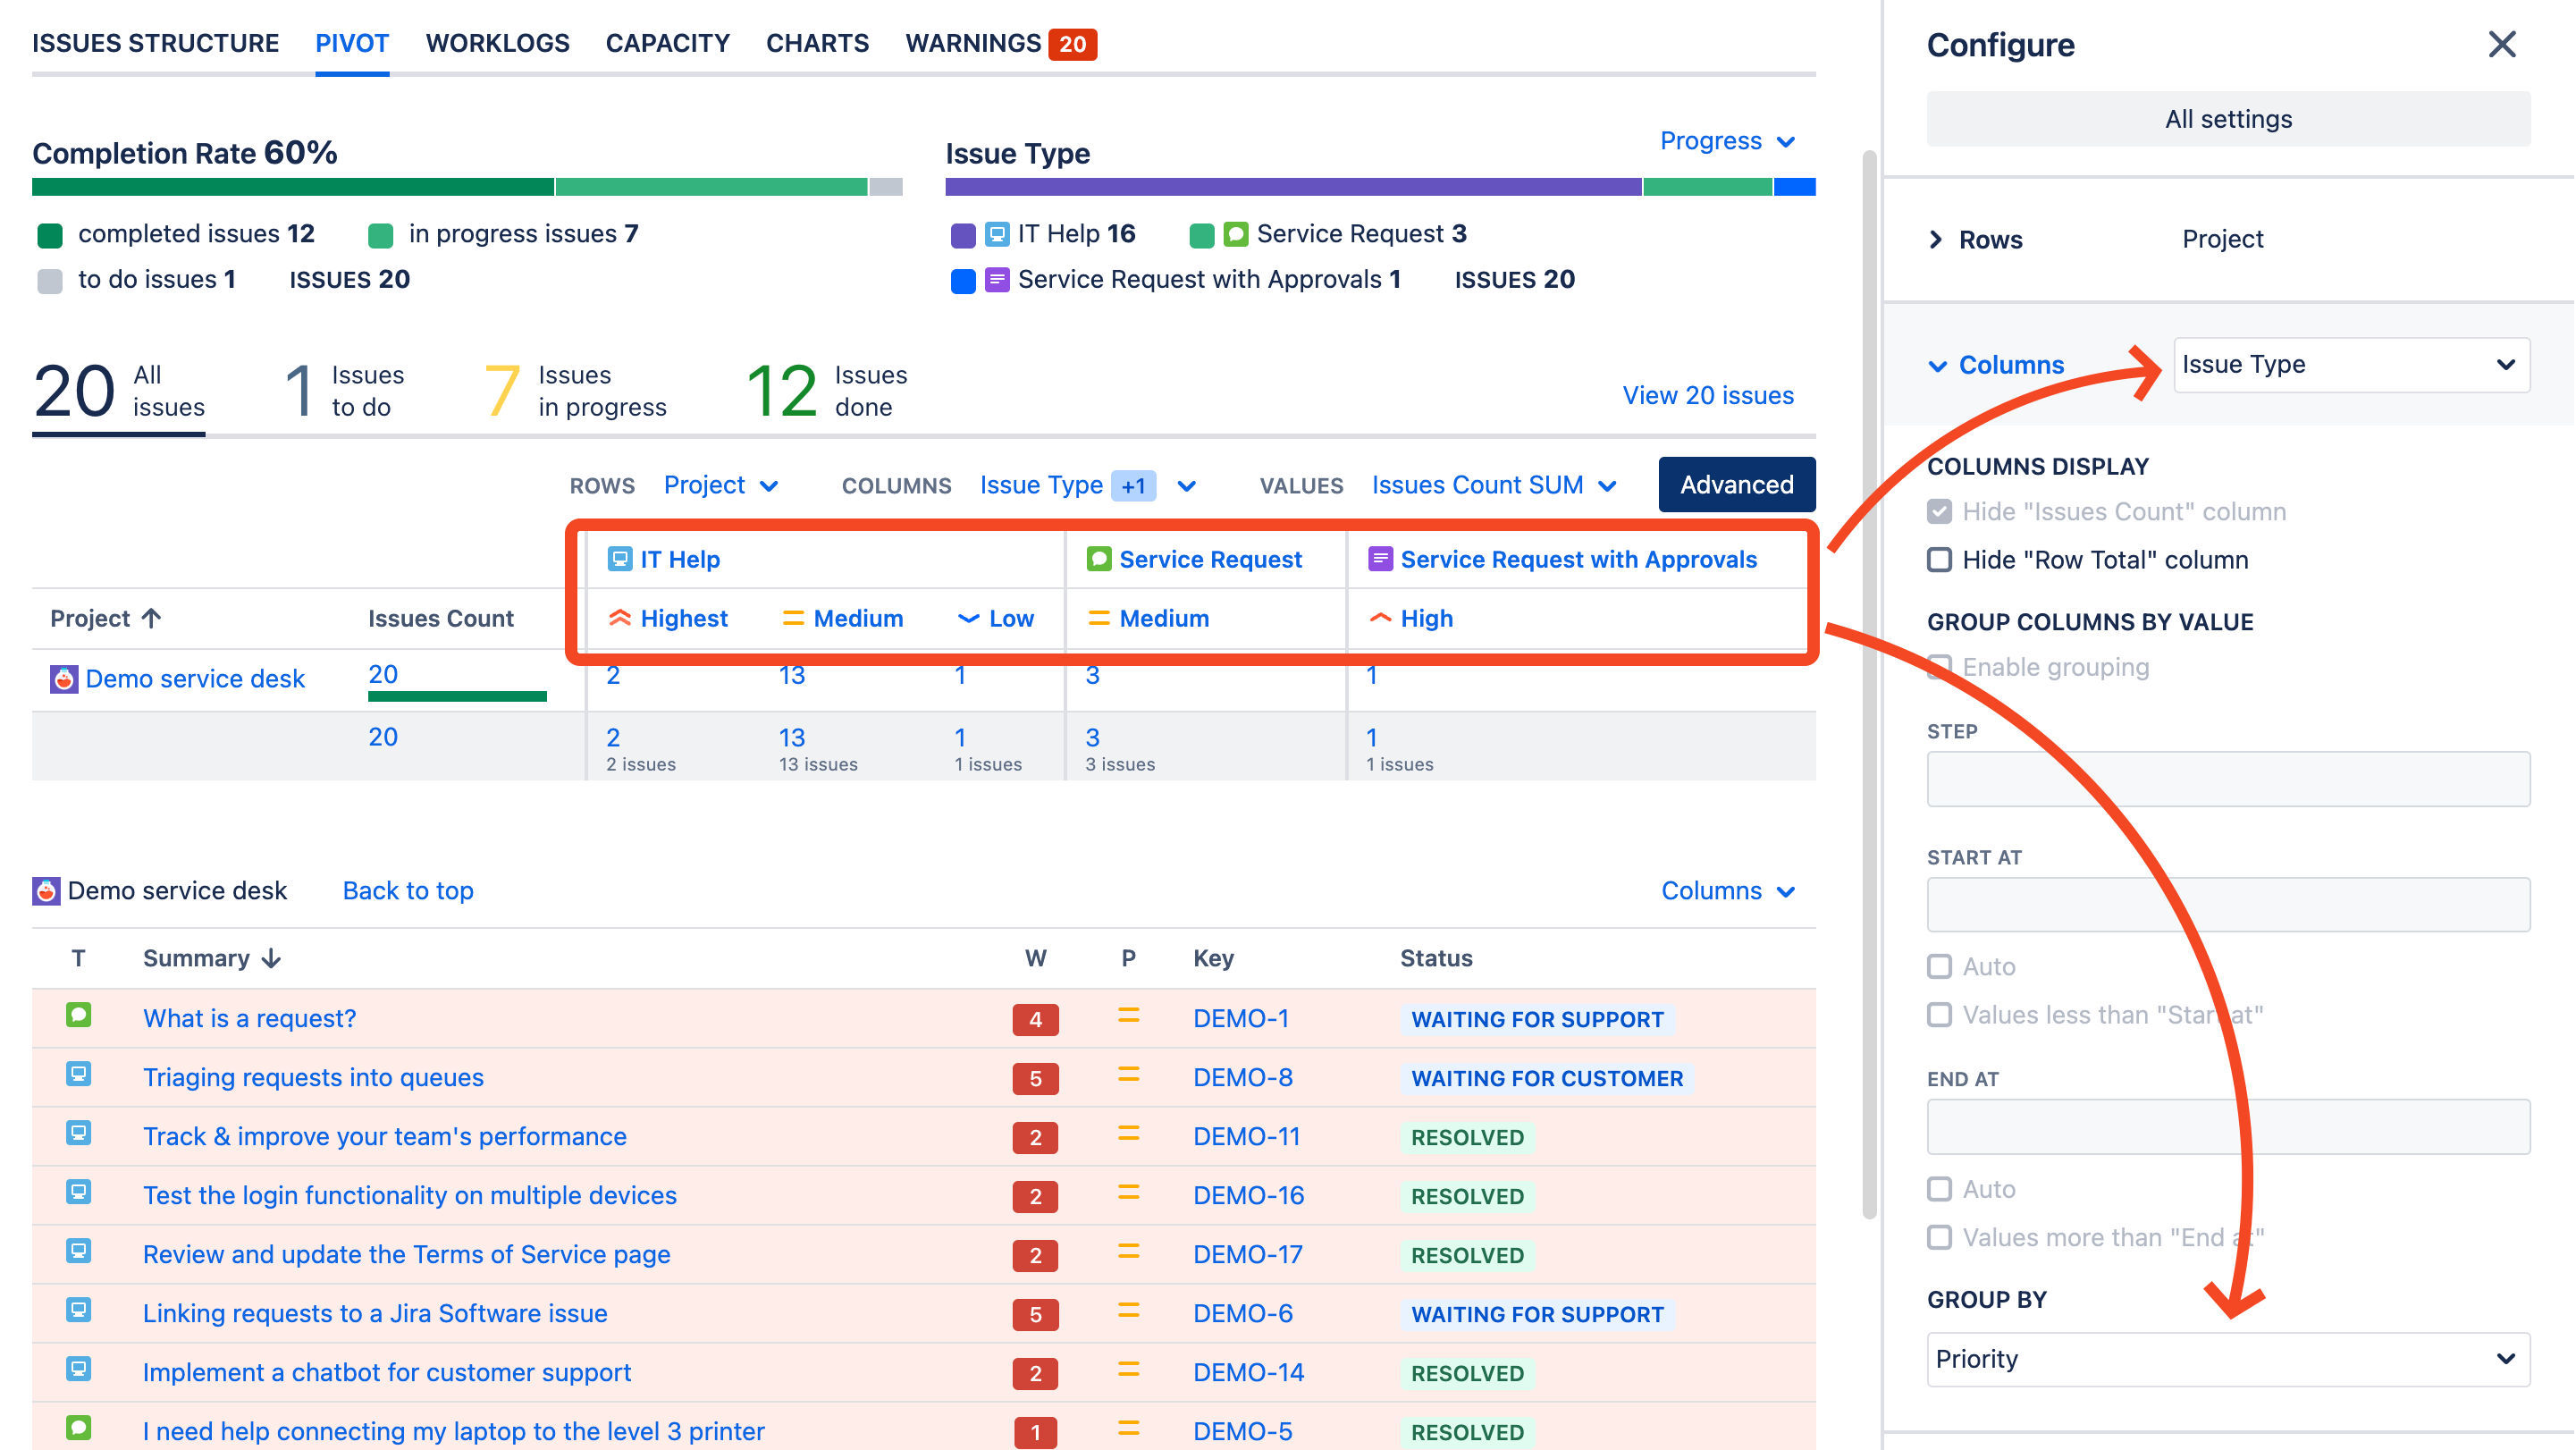
Similar to the capability to configure multiple Rows for the Pivot summary, you can now utilize up to two levels to group work items in columns.
In the example below, work items are initially grouped by Work item Type columns and then by Priority level.
Additional highlights
Theming Support
Full support for Jira themes (Light, Dark, or Match browser) is now available on Cloud for Pivot reports. Once themes are supported by Atlassian for Jira on Data Center/Server, we will implement them as well.
Column dragging
The behavior for users dragging columns within the Breakdown section of the report has been updated. Notable improvements include highlighting the entire column and clearly identifying the column header for dragging.
Manage Report page
The layout of the Manage Pivot Reports page has been updated by removing the left-side options and replacing them with buttons above the header of the table. This change is designed to facilitate users who are using Jira on handheld devices.

Thank you
We’re incredibly proud of this update and are immensely grateful for all your feedback. Our commitment is to enhance your reporting experience, and we eagerly anticipate how you’ll utilize these new features.
You can communicate with our support team concerning any of these changes through this portal.
Happy reporting, everyone!