
This article explains why and how to integrate Atlassian’s Jira Service Management (JSM) with the Pivot Report app. To learn more about JSM, refer to this separate article.
How do SLAs and goals work?
Once an issue or a ticket is created by a user within Jira Service Management (JSM), it is measured against a Service Level Agreement (SLA), such as Time to resolution or Time to first response.
-
Each SLA defines when its clock starts, pauses, and stops, and it may contain multiple goals.
-
Each goal defines how much time is on a clock before a breach occurs.
For example, your team has 4 hours for resolving a high-priority ticket. This goal’s SLA clock counts down to zero. Afterwards, it continues to increment negative numbers, which represent that the target of 4 hours is breached.
How are SLAs displayed?
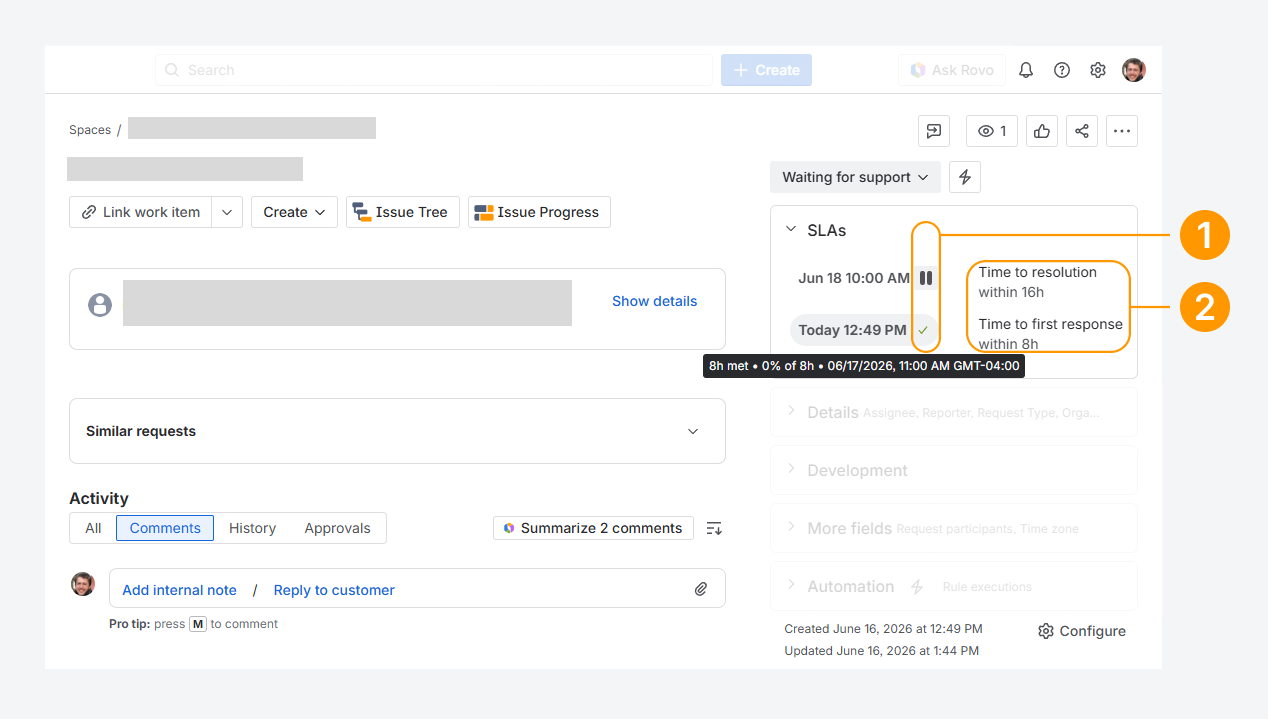
SLAs are displayed in queues and on work items, allowing you to track the status of a service-level agreement. They contain the following elements:
-
Status icon: This element indicates the current status of the SLA. The following icons are used:
Pause – A pause icon is displayed when the SLA clock has stopped counting, as shown in the example above. This typically occurs when the issue is in a status such as Waiting for Customer or On Hold, where the next action is outside the team's control. These statuses are defined in the SLA configuration. The pause icon turns red if the SLA is breached.
Red cross – A red cross is displayed when the SLA target has been breached.
Green check – A green check is displayed when the request is completed within the SLA target, as shown in the example above.
When you hover over the icon, a tooltip appears showing whether the SLA target was met or breached, along with the remaining time or the amount of time elapsed since the breach occurred. The tooltip also displays the relevant date for that status. In the example above, the tooltip indicates that the 8-hour SLA target was met on June 17, 2026.
-
Time to First Response and Time to Resolution: This element identifies the SLA being measured and displays the current SLA time for the request.
What are Time to First Response and Time to Resolution?
Every ticket in a Jira Service Management (JSM) project is measured against one or more Service Level Agreements (SLAs). These SLAs define the amount of time available for agents to respond to or resolve customer requests.
-
Time to Resolution: Also known as Resolution Time, this metric measures the elapsed time between an issue's Created Date and Resolution Date.
When displayed as a whole number, fractional values are truncated. For example, a resolution time of 4/3 days (1.333 days) is displayed as 1 day.
-
Time to First Response: This metric measures the time taken for the first response to be sent by an agent to the customer after the ticket is created.
Only public responses are considered. Internal notes are visible only to agents and authorized Jira users and are therefore not counted as a first response.
Why should you integrate the app with JSM?
The following Jira Service Management (JSM) features provide a starting point for monitoring issues and tracking SLA performance.
-
Queues and work items: SLAs displayed in queues and on work items provide only a limited view of SLA performance. For example, they do not indicate whether an SLA was breached in the most recent cycle or whether it was breached in a previous cycle.
-
JSM reports: The reporting options available in Jira Service Management are also limited. They do not allow you to fully customize report elements across multiple tabs or create a consolidated view of factors that may contribute to SLA breaches, such as the number of comments on a ticket and whether those breaches affect customer satisfaction ratings, while filtering each rating.
-
Issue Navigator: As shown in the screenshot below, the Issue Navigator displays the Time to First Response and Time to Resolution columns. However, it does not indicate how recently a breach occurred, how much time has elapsed for a breached SLA, or how much time remained on the clock when the SLA was met.
-20260616-025825.png?cb=da67851b1d2302d42960dae43276aa2a)
In comparison, the app allows you to analyze the data from these features in greater detail by using additional tools, such as charts for each comment type, progress indicators that show the number of breached or paused tickets, and filters based on customer satisfaction ratings.
Features and use cases
Display SLA targets and JSM metrics as Columns
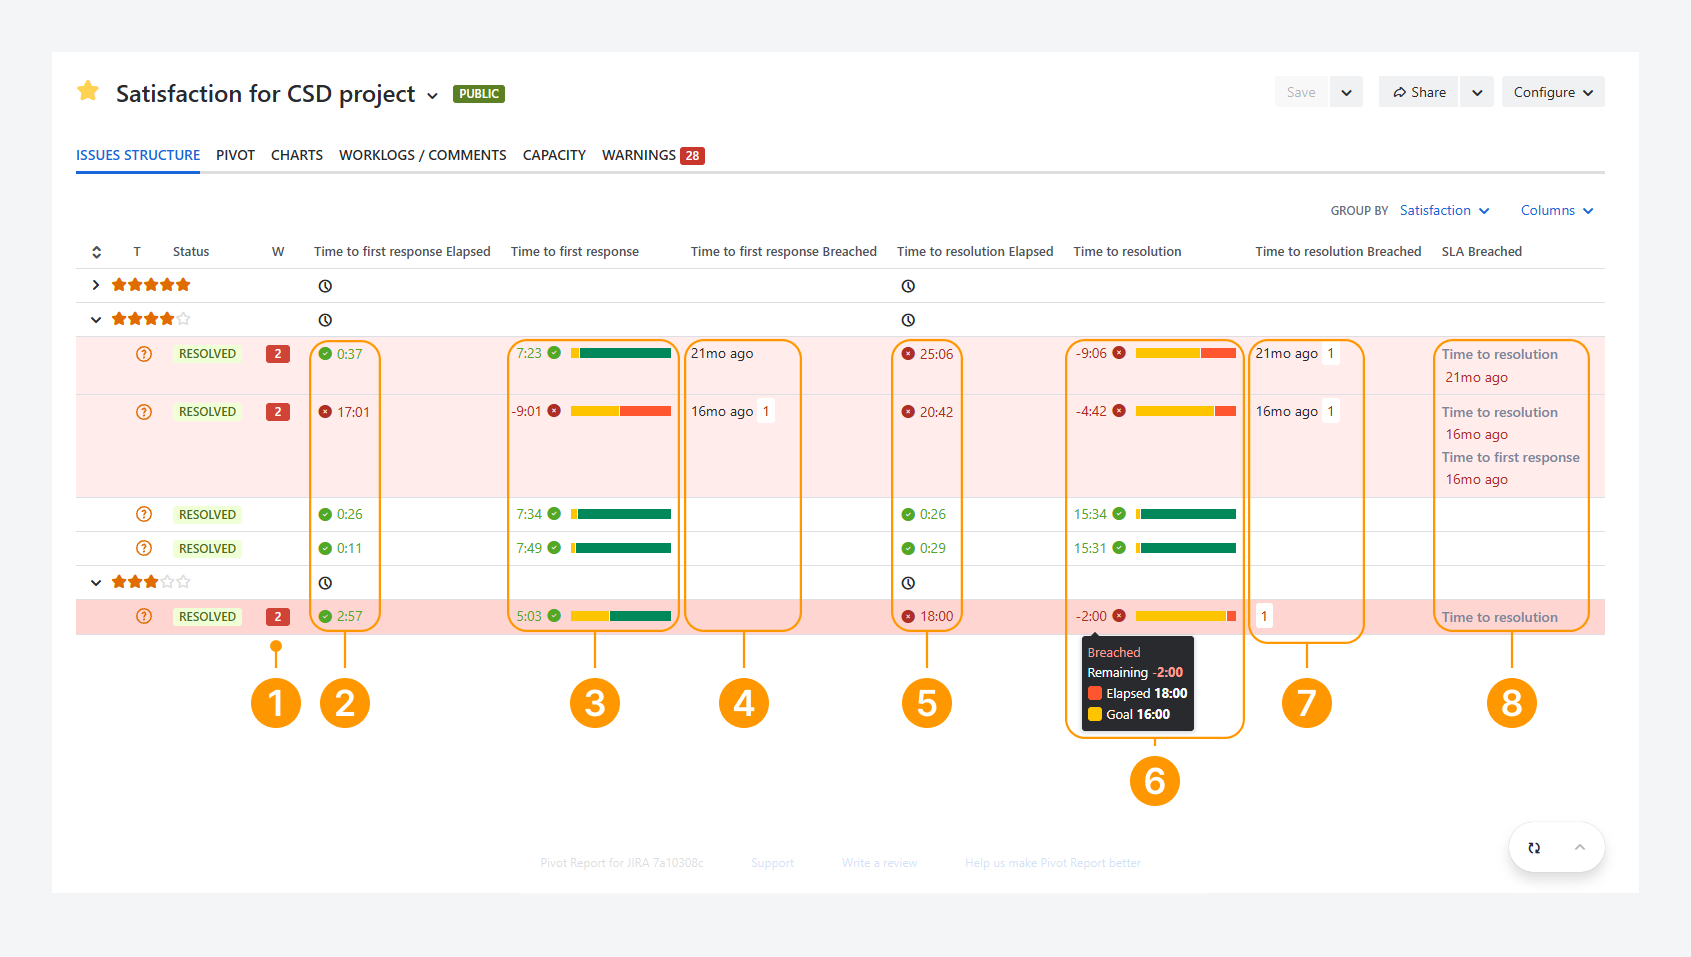
The app supports the following columns:
-
Warnings: This column identifies how many warnings were triggered for an issue and displays them in a tooltip when you hover over the count shown in a red box.
Two Jira Service Management (JSM) warnings are available:
SLA Breached – Identifies issues whose current or most recent SLA cycle failed to meet its target.
SLA Ever Breached – Identifies issues that failed to meet their target in any SLA cycle.
In the example above, three tickets are highlighted in red and trigger both warnings. To enable SLA-related warnings or all available warnings, follow the instructions provided in the related article.
-
Time to First Response Elapsed: This column shows the current state of the Time to First Response SLA clock. If the SLA target has not been met, the column displays the remaining time until the breach. If the target has been breached, it displays the elapsed time since the breach occurred.
In the example, green clocks indicate time remaining within the SLA target, while red clocks indicate that the target has been breached.
-
Time to First Response: This column displays the Time to First Response SLA indicator. The progress bar automatically adjusts its size and color based on whether the SLA target is met or breached.
If the SLA target has not been met, the left portion of the bar represents the elapsed time, while the right portion represents the remaining time until the SLA is exceeded. When the target is met, the right portion is green.
If the target has been breached, the left portion of the bar represents the SLA goal, while the right portion represents the amount of time by which the SLA has been exceeded. When the target is not met, the right portion is red.
An SLA clock is also displayed. It remains green while the issue is within the target and turns red when the target is breached. The clock then shows the amount of time by which the SLA has been exceeded, as a negative number.
-
Time to First Response Breached: This column shows how recently the Time to First Response SLA was breached. It also includes a link that opens the Issue View pop-up.
In the example above, one ticket breached the Time to First Response target 16 months ago. You can open the ticket by clicking the 1 displayed next to the duration.
-
Time to Resolution Elapsed: This column shows the current state of the Time to Resolution SLA clock. If the SLA target has not been met, the column displays the remaining time until the breach. If the target has been breached, it displays the elapsed time since the breach occurred.
In the example, green clocks indicate time remaining within the SLA target, while red clocks indicate that the target has been breached.
-
Time to Resolution: This column displays the Time to Resolution SLA indicator. The progress bar automatically adjusts its size and color based on whether the SLA target is met or breached.
If the SLA target has not been met, the left portion of the bar represents the elapsed time, while the right portion represents the remaining time until the SLA is exceeded. When the target is met, the right portion is green.
If the target has been breached, the left portion of the bar represents the SLA goal, while the right portion represents the amount of time by which the SLA has been exceeded. When the target is not met, the right portion is red.
An SLA clock is also displayed. It remains green while the issue is within the target and turns red when the target is breached. The clock then shows the amount of time by which the SLA has been exceeded, as a negative number.
In the example above, clicking the indicator displays a tooltip containing the remaining time, elapsed time, and SLA goal.
-
Time to Resolution Breached: This column shows how recently the Time to Resolution SLA was breached. It also includes a link that opens the Issue View pop-up.
In the example above, one ticket breached the Time to Resolution target 21 months ago. You can open the ticket by clicking the 1 displayed next to the duration.
-
SLA Breached: This column shows how recently an issue's current or most recent SLA cycle failed to meet its target.
In the example above, an issue breached both the Time to First Response and Time to Resolution targets 16 months ago.
The SLA Ever Breached column is also available, although it is not shown in the example. This column shows how recently an issue failed to meet its target in any SLA cycle.
Measure SLA within progress indicators
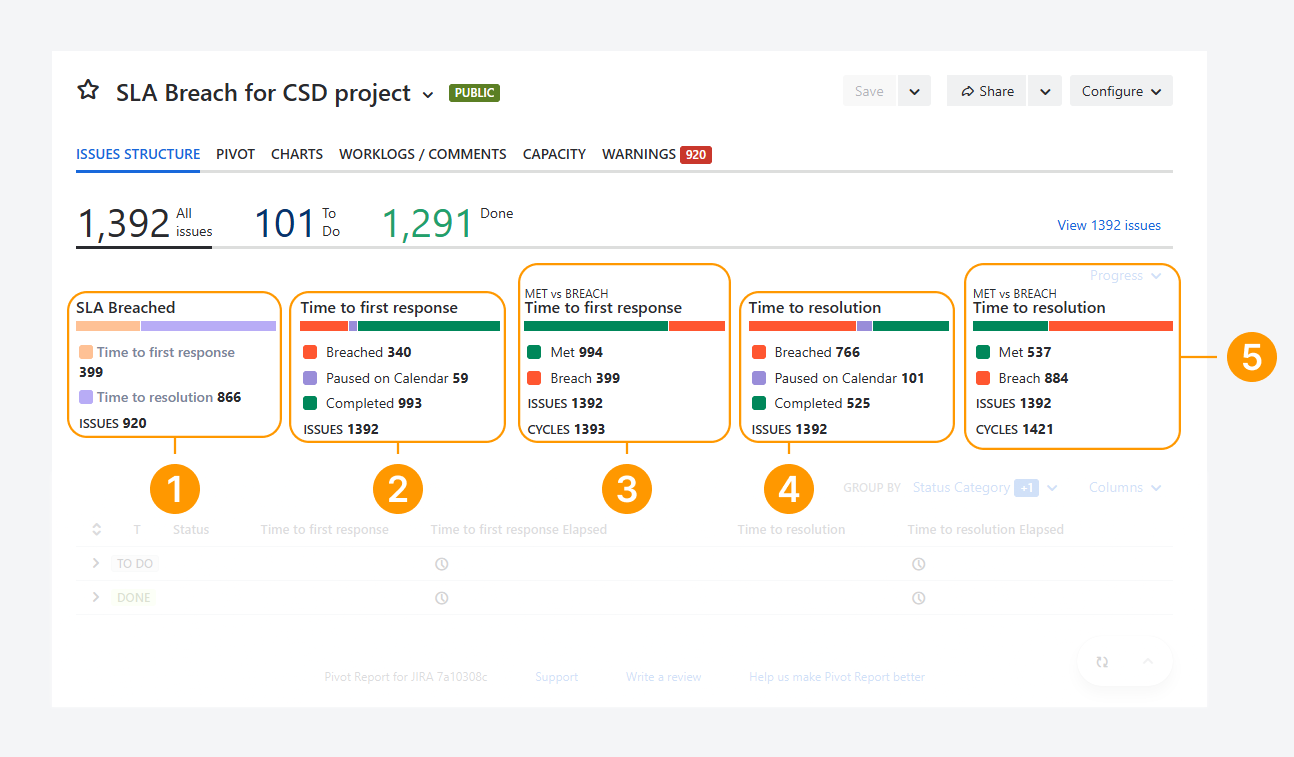
The app supports the following progress indicators:
-
SLA Breached: This indicator returns the list of issues whose current or most recent SLA cycle failed to meet its target.
For example, 399 issues have breached the Time to First Response target, and 860 issues have breached the Time to Resolution target.
The SLA Ever Breached indicator is also available, although it is not shown in the example. It returns issues that failed to meet their target in any SLA cycle.
-
Time to First Response: This indicator shows issues whose Time to First Response SLA is in a Breached, Paused, or Completed state.
For example, 993 of 1,392 issues were completed and met the target, 340 issues breached the target, and 59 issues were paused.
-
Time to First Response: Met vs Breached: This indicator returns issues that either met or failed to meet their Time to First Response target.
For example, 399 issues (340 breached issues and 59 paused issues) failed to meet the target, while 994 issues (993 completed issues and 1 successful cycle) met the target.
-
Time to Resolution: This indicator shows issues whose Time to Resolution SLA is in a Breached, Paused, or Completed state.
For example, 525 of 1,392 issues were completed and met the target, 766 issues breached the target, and 101 issues were paused.
-
Time to Resolution: Met vs Breached: This indicator returns issues that either met or failed to meet their Time to Resolution target.
For example, 884 issues (766 breached issues, 101 paused issues, and 17 failed cycles) failed to meet the target, while 537 issues (525 completed issues and 12 successful cycles) met the target.
Display the Satisfaction rating for tickets
-20260620-014120.png?cb=46c845f66b5d81bcf9a09f8df088b9b5)
Jira Service Management (JSM) includes built-in customer satisfaction surveys that allow users to rate their support experience when a ticket is resolved. Ratings range from 5 stars (Very Satisfied) to 1 star (Very Unsatisfied).
The screenshot above shows several ways to display and analyze Satisfaction ratings within the Issue Structure tab type.
-
Slices: You can create a slice for each satisfaction rating using custom JQL. For example, the following query returns tickets with a 5-star rating:
satisfaction IN ("5"). The screenshot above shows the issue count for each satisfaction rating. -
Single Progress Indicator: The overall Satisfaction rating for all tickets in the report can be displayed as a single progress indicator. This indicator shows the average rating and the total number of rated tickets. In the example above, 63 resolved tickets have an overall Satisfaction rating of 4.9.
-
Completion Progress Indicator: The overall Satisfaction rating for all tickets in the report can also be displayed as a completion progress indicator. This indicator shows the average Satisfaction rating together with the number of tickets at each rating level. In the example above, 58 of 63 resolved tickets received a 5-star rating, resulting in an overall Satisfaction rating of 4.9 out of 5.
-
Group: The Satisfaction rating can be used to group and sort issues within a report, similar to the Issue Navigator. For example, tickets with a 3-star rating can be grouped separately from tickets with 4-star and 5-star ratings.
-
Column: The Satisfaction rating can also be displayed as a column in the Summary section of the Issue Structure tab type or in the Breakdown section of other tab types. Clicking the column header sorts the groups by rating. In the screenshot above, the groups are sorted by rating, allowing tickets with the same Satisfaction score to be displayed together.
Display the Time to resolution for each Satisfaction rating
-20260620-030434.png?cb=5948841f8ab8023c1a2ba8acd1eed4a6)
The screenshot above shows how Time to Resolution can be analyzed by Satisfaction rating within the Pivot tab type.
The purpose of the table in the Pivot tab type is to determine whether tickets with lower average Time to Resolution also receive higher Satisfaction ratings.
-
Time to Resolution: The average time required to resolve a ticket is displayed in the Summary section. A separate value is shown for each Satisfaction rating.
In the example above, one of the 63 resolved tickets received a 3-star Satisfaction rating and took 18 hours to resolve. Across all tickets, the average resolution time is 28 hours.
-
Resolution Type: Resolution time can also be analyzed by resolution type. In the example above, two resolution types are configured: Answered and Fixed. These appear as separate columns in the Summary section.
Tickets categorized as Answered were resolved by providing guidance, clarification, or a configuration change. In the example above, 39 tickets were answered with an average resolution time of 19 hours.
Tickets categorized as Fixed required a product patch before they could be resolved. In the example above, 24 tickets were fixed with an average resolution time of 43 hours.
-
Breach: The Breakdown section can be used to show whether the time taken to resolve a ticket exceeded its SLA target.
In the example above, a ticket with a 3-star Satisfaction rating was resolved in 18 hours. Because the SLA target was 16 hours, the ticket exceeded the target by 2 hours and is therefore classified as breached.
For the example above, a longer average resolution time is associated with a higher Satisfaction rating, even when the SLA target is exceeded.
Display the Time to resolution compared the amount of comments
-20260622-230933.png?cb=6dc4f1627da71df1a9adf23e0d0f9ccf)
The example above shows a Bar chart in the Charts tab type. The orange bars represent the number of issues (Issue Count) for each comment count, while the grey bars represent the average Time to Resolution for issues with that number of comments.
The purpose of this chart is to determine whether the average Time to Resolution increases as the number of comments per ticket increases.
The chart shows that most issues contain five comments or fewer, as indicated by the concentration of orange bars on the left side. This indicates that issues with fewer comments are the most common.
By comparison, the average Time to Resolution increases for issues containing between 11 and 19 comments. This suggests that issues with a higher number of comments generally take longer to resolve. For issues with 39 or more comments, the average resolution time increases further. However, these values are based on a relatively small number of issues and may represent outliers.
In the same report, the Pivot tab type shows an average Time to Resolution of 2 days and 2 hours across all 372 issues. This average is exceeded by groups of issues containing five or more comments, which further confirms at least half or most issuescontain five comments or fewer.
In this example, the majority of issues are resolved with relatively few comments, resulting in a lower overall average Time to Resolution, even though the SLA target is exceeded for nearly all groups.
While a higher number of comments is often associated with a higher average Time to Resolution, issues with a large number of comments represent only a small proportion of all issues and therefore do not significantly affect the overall average Time to Resolution.
Display the Time to resolution for External and Customer comments
-20260622-234426.png?cb=7f0963bcaa1bafafd5ca1e7872369931)
The example above shows a Bubble chart in the Charts tab type. The orange bubbles represent the number of tickets (Issue Count) for each combination of comment counts, while the grey bubbles represent the average Time to Resolution for tickets with those values.
The larger orange bubbles in the lower-left area indicate a concentration of tickets with three comments or fewer. In contrast, the larger grey bubbles in the upper-right area indicate higher average Time to Resolution for tickets with six or more comments.
The chart compares two comment types: External Comments on the x-axis and Customer Comments on the y-axis.
-20260623-021106.png?cb=c60540a72b4a15241323f68ec1a607fc)
By selecting the orange bubble in the lower-left corner (representing 1 External Comment and 1 Customer Comment), a breakdown pop-up displays the 30 tickets in this group, as shown in the screenshot above.
The purpose of this chart is to determine whether the average Time to Resolution increases as the number of External Comments or Customer Comments per ticket increases.
This may indicate whether additional communication from agents or customers is associated with longer resolution times.
The comment types can be defined as follows:
-
Customer Comments: Customer Comments are created when a customer submits or replies to a ticket through the Customer Portal, replies to an email notification for an existing ticket, or sends an email that creates a new ticket.
These comments are visible to the customer, agents, and authorized Jira Service Management users in both the Customer Portal and Jira Service Management. As shown in the Progress section, there are 872 Customer Comments across the 368 tickets included in the report.
-
External Comments: External Comments are created by agents or authorized Jira Service Management users when responding to the ticket reporter.
These comments are visible to the customer, agents, and authorized Jira Service Management users in both the Customer Portal and Jira Service Management. As shown in the Progress section, there are 1,088 External Comments across the 368 tickets included in the report.
-
Internal Comments: Internal Comments are created by agents or authorized Jira Service Management users and are visible only to agents and authorized users.
These comments are hidden from customers and do not appear in the Customer Portal. As shown in the Progress section, there are 313 External Comments across the 368 tickets included in the report.
-
Agent Comments: Agent Comments represent the combined total of External Comments and Internal Comments. Since both comment types are created by agents, this metric can be used to measure the overall level of agent activity on a ticket.
In the same report, the Pivot tab shows an average Time to Resolution of 1 day and 22 hours across all 368 tickets. This average is exceeded by groups of tickets containing three or more comments, which suggests that at least half or most tickets fall within the lower comment range.
In this example, the majority of tickets are resolved within three External and Customer Comments, resulting in a lower overall average Time to Resolution, even though the SLA target is exceeded for most groups within this range.
A near 1:1 relationship between External and Customer Comments is also observed for tickets with fewer than four comments. This means that both comments are contributing almost equally to the average Time to Resolution.
For tickets with more than four comments, a higher number of comments is generally associated with a higher average Time to Resolution. However, these tickets represent only a small proportion of the dataset and therefore do not significantly affect the overall average Time to Resolution.
How can you integrate the app with JSM?
To integrate the app with Jira Service Management (JSM), follow the installation steps described in the separate installation article. The integration process is the same as the one used to install the app for Jira.
FAQ
Can you see the SLA calculations for users working in a different time zone?
Yes. All users see the same SLA calculations in Jira Service Management (JSM), regardless of their personal time zone settings.
SLA calculations are based on the time zone configured for the SLA calendar, which is independent of both the user's profile time zone and Jira's default time zone.
For example, a user in Montreal and a user in Jakarta will see the same Time to Resolution value for the same ticket in a report.
The same behavior applies in the work item view, where SLA calculations are displayed consistently for all users, regardless of their location.
-20260616-222856.png?cb=e4e822d4b91f171896965a0f53314775)
-20260616-223459.png?cb=b959af7a5a639aabb096c23f5eb05632)
While users in different time zones may see timestamps displayed in their local time, the underlying SLA calculations remain the same because they are based on the SLA calendar configuration.
How are these measurements different from Time Since Comment fields?
The Time Since Comment fields are shown in the screenshot below. Within the Summary section, these fields measure the amount of time that has elapsed between a comment's date and time and the current date and time.
In contrast, SLA metrics stop accumulating time once their target condition is met.
For example, the Time to First Response SLA stops when the first response is provided to the customer. However, the Time Since First Comment field continues to increase after the comment is created.
Additionally, the Time Since Comment fields are not affected by calendars that define working hours or working days, nor by time zone configurations.
-20260623-201151.png?cb=365b583983d3b1ec9d617ca794aec04a)
Unlike the other columns shown in the screenshot above, the Time Since First Comment and Time Since Last Comment fields are available for both Jira and Jira Service Management (JSM) projects.
Troubleshooting
If you have questions or need assistance, contact our support team via email or service desk. Our team is available Monday through Friday (9:00 AM to 7:00 PM GMT+7) to help with technical challenges or discuss improvements.