
Tabs
Can you customize, rename, or remove tab types?
Yes, you can customize, rename, or remove tab types as detailed in a separate article.
At least one tab must remain active in every report. You can enable up to eight tabs in a single report.
By default, six tab types are included when you create a new report: Work item Structure, Pivot, Charts, Worklogs, Capacity, and Warnings. To learn more about tab types, refer to the related article.
How many levels can be shown in the Summary section of each tab type?
In each tab type, you can group data using multiple fields for rows, columns, or other graphical elements. By selecting a field, you add a level to the granularity of the grouped data.
Work item structure tab
The table in the Summary section of the Work item Structure tab type allows up to 6 levels for Group By.
Pivot tab
The table in the Summary section of the Pivot tab type allows up to 2 levels for Columns and up to 6 levels for Rows.
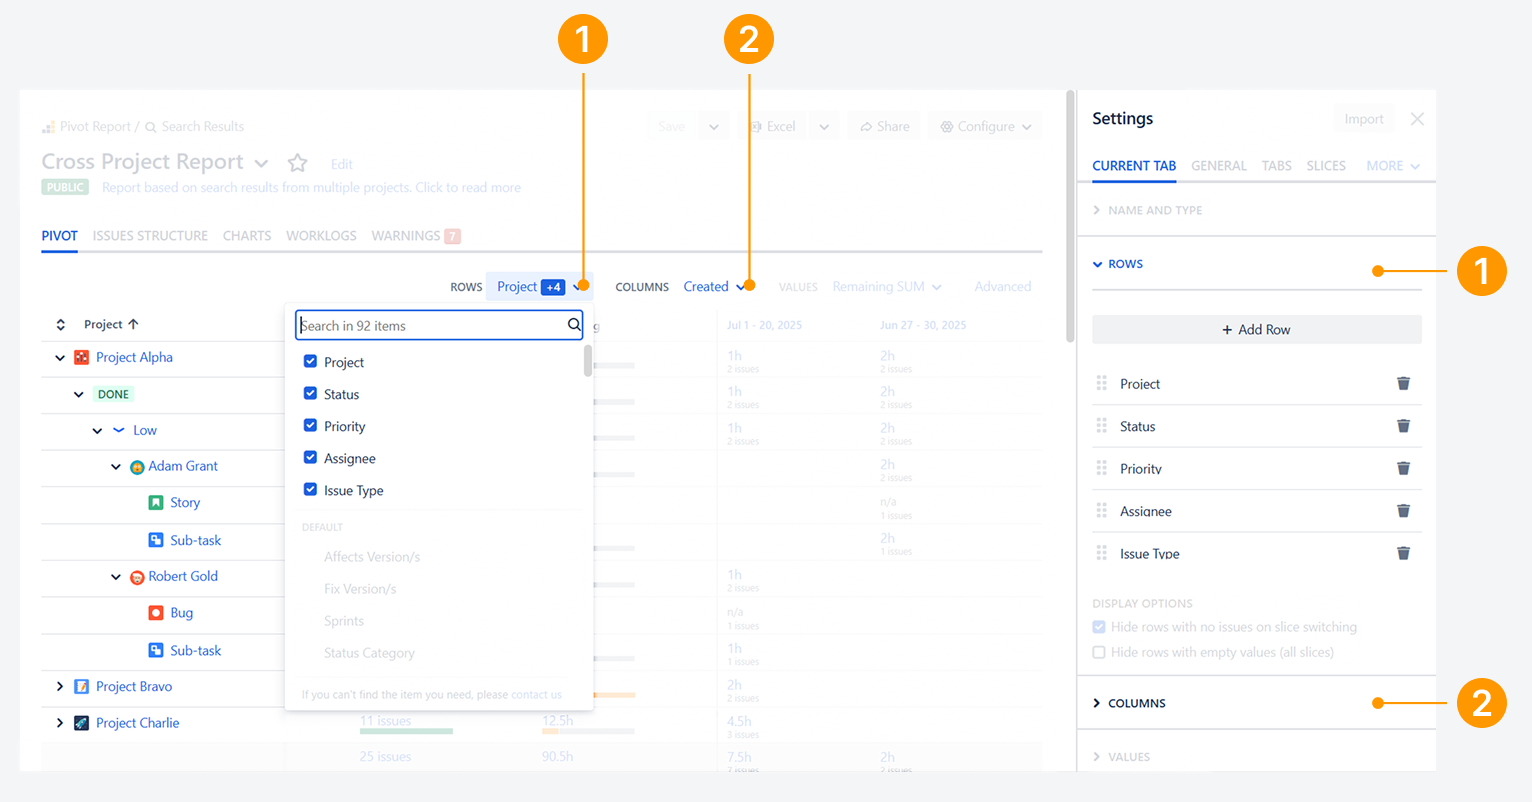
In the example above:
-
Rows: 5 levels are used, starting with the Space field. The ‘+4’ next to Space means 4 additional levels are hidden in the dropdown menu. These include Status, Priority, Assignee, and Work item Type.
-
Columns: Only the Created field is used, showing the work item creation date.
Can you define a custom hierarchy for the report work items?
Yes, you can define a custom hierarchy at the report level or app-level, which may differ from the hierarchy set for your Work item Types, as explained in a separate article.
Slices
Can you display a maximum number of Slices?
No. There is no limit to how many Slices can be displayed.
However, your screen resolution may limit how many Slices are visible at once—commonly to 6 or 11. Any Slices that do not fit on the screen will appear in a dropdown menu.
Can Slices affect Progress indicators?
Yes, Slices can be configured to affect Progress indicators, as described in a separate article.
Progress indicators
What’s the maximum number of indicators shown?
There is no limit to how many Progress indicators you can enable.
However, screen resolution may affect readability. Each additional indicator reduces the space available for the others, which may cause earlier indicators to become harder to read.
Breakdown section
What’s the maximum number of columns shown?
There is no limit to the number of columns you can enable in the Breakdown section.
However, screen resolution may affect readability. As you add more columns, the available space for each field decreases, which can make earlier columns harder to read and cause a horizontal scrollbar to appear.
Pop-up section
Is the Breakdown pop-up shown for Gadgets?
Yes, the Breakdown pop-up is also available in Dashboard Gadgets.
However, unlike in a report, when you click an element within a Gadget, the pop-up content opens in a new browser tab.
Can you edit work items using the Work item View pop-up?
Yes. You can edit work items directly from the Work item View pop-up, as long as your user account has the required field edit permissions. These permissions are managed by your Jira administrator.
After editing an work item in the Work item View pop-up, the report will prompt you to save and reload your changes by clicking the ‘Reload report’ button, as shown in the screenshot.
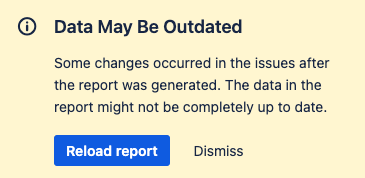
This step is required because your edits have changed the report’s source data.
If you have questions or need assistance, contact our support team via email or service desk. Our team is available Monday through Friday (9:00 AM to 7:00 PM GMT+7) to help with technical challenges or discuss improvements.