
-20260305-194342.png?cb=9ef81a0bb40c612b172752fd75006c43)
This article explains why and how to create a Kanban and sprint-based report using the Board’s action menu for Company-managed projects.
What are the advantages of using sprint-based reports?
-
This method is ideal when you need monitor dependencies for issues within a hierarchy, which belong to a single or to concurrent sprints,
-
A report based on a Board allows to track you much quickly issues that last multiple sprint, without leaving the Board navigation.
Features and use cases
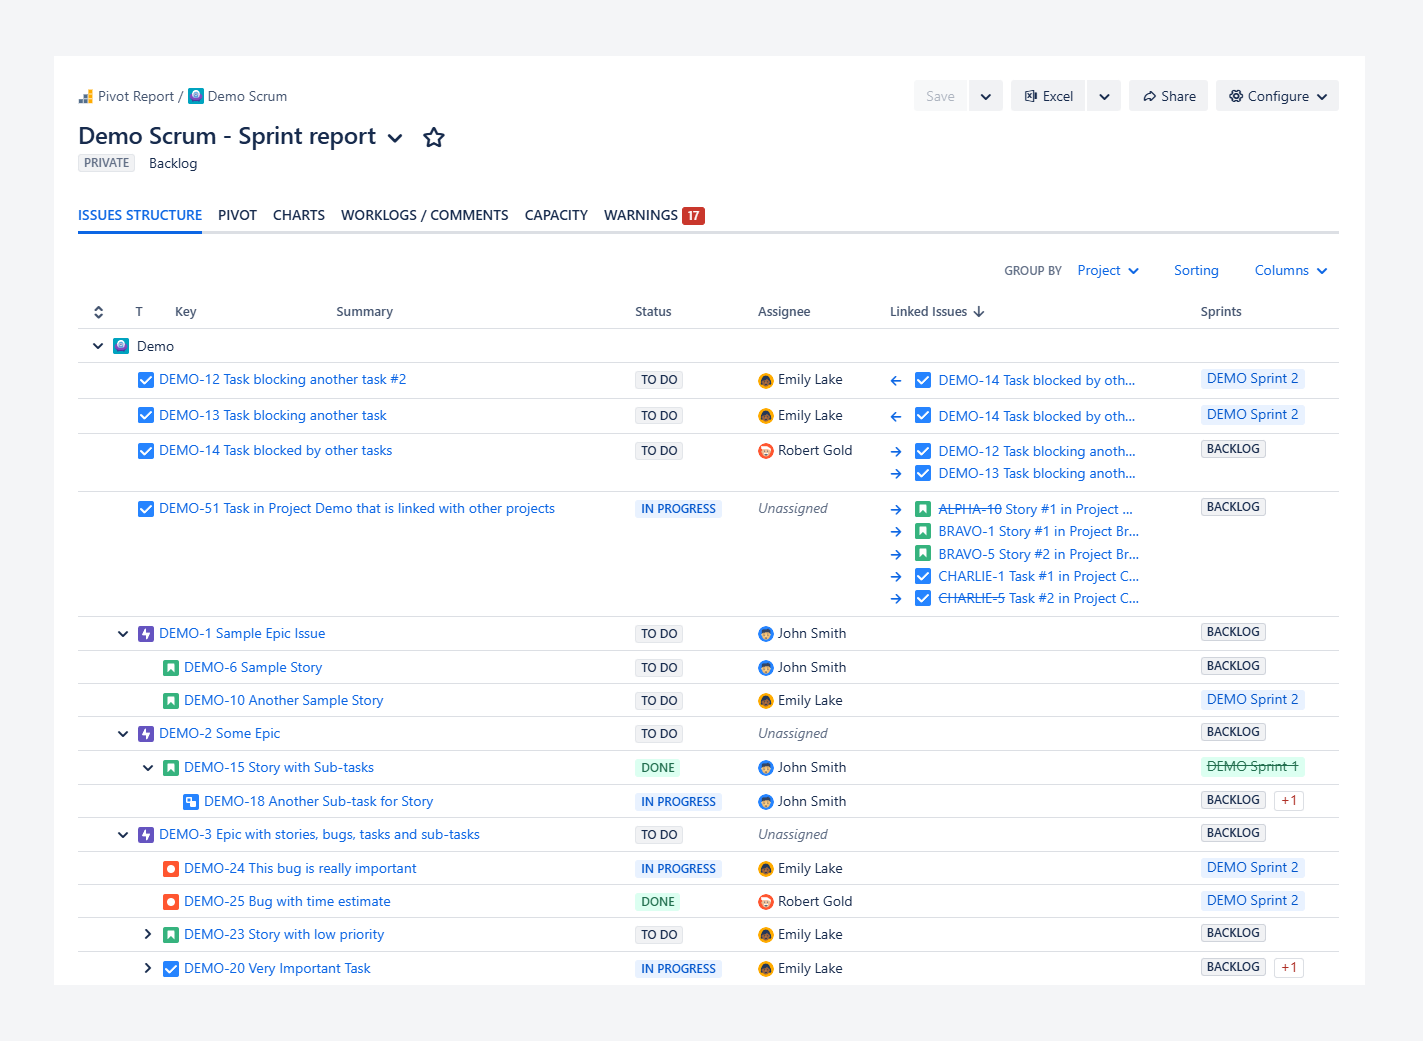
Display dependencies within a hierarchy for sprint deliverables
While you can display linked issues in the card layout of Active Sprints and the Backlog view on a board, you cannot see how each card fits into the full hierarchy.
This limits visibility into the complete dependency tree and may lead to work being scheduled out of sequence, which can create bottlenecks later.
In contrast, a report displays issues within their hierarchy, along with their dependencies and assigned sprint.
Create a report for Closed sprints
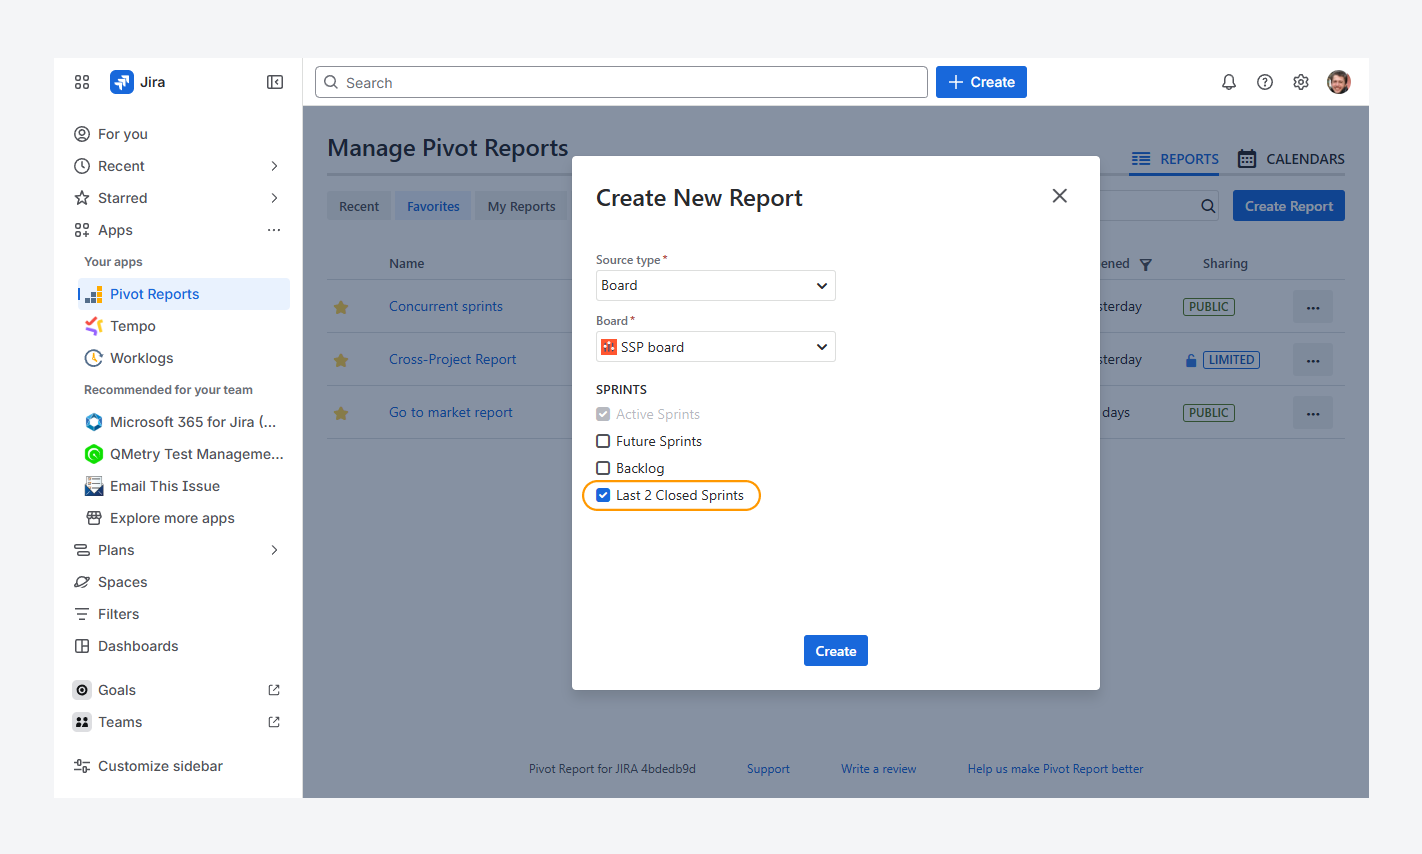
You can create a report from the Manage Pivot Reports page or from within a Board, referencing up to two closed sprints.
-20260306-040437.png?cb=5eb4bad8bd8b18d7862a722b81bef761)
Afterwards, you can update the report source to include up to five closed sprints, as shown in the screenshot above, by following the steps in the related article.
Closed sprints cannot be displayed on a board. In contrast, you can create a report specifically for those sprints, to perform a retrospective of what what delivered.
In the screenshot below, a completed sprint appears with a green label and strikethrough text, while an active sprint is shown with a blue label and no strikethrough.
In the example, the Remaining Time for completed issues in the closed sprint is 7 hours. If the original estimates were unchanged, these hours were likely overestimated.
Even after accounting for these 7 hours, more than six days of work remain for issues planned but not completed during the sprint. This indicates that the sprint was not successfully delivered as scheduled.
-20260305-194528.png?cb=beeef7ee369a5a97c7e4080b45c76d63)
Create a report for Custom sprints
You cannot create a report that references custom sprints directly from the board. However, you can update the report source to include them, as described in the related article.
The screenshot below shows a custom sprint added to the report source.
-20260306-040501.png?cb=fa9e2f41fd02266ebe11fd80e338a084)
By focusing a report on one or multiple custom sprints—whether active or closed—you can separate current and past sprint contents for more targeted analysis.
For example, a report created for a single sprint, as shown below, lets you monitor the remaining time for that sprint alongside issue status, assignee, priority, and issue type. If an assignee’s remaining work exceeds the sprint’s remaining time, those deliverables are at risk of not being completed.
In the screenshot, Emily Lake has over two weeks’ worth of deliverables remaining. If the sprint lasts only two weeks, these tasks are unlikely to be finished.
-20260305-194605.png?cb=3545cc2d344b770e3bee2ed9fbfbc52c)
Display deliverables that have been assigned to multiple sprints
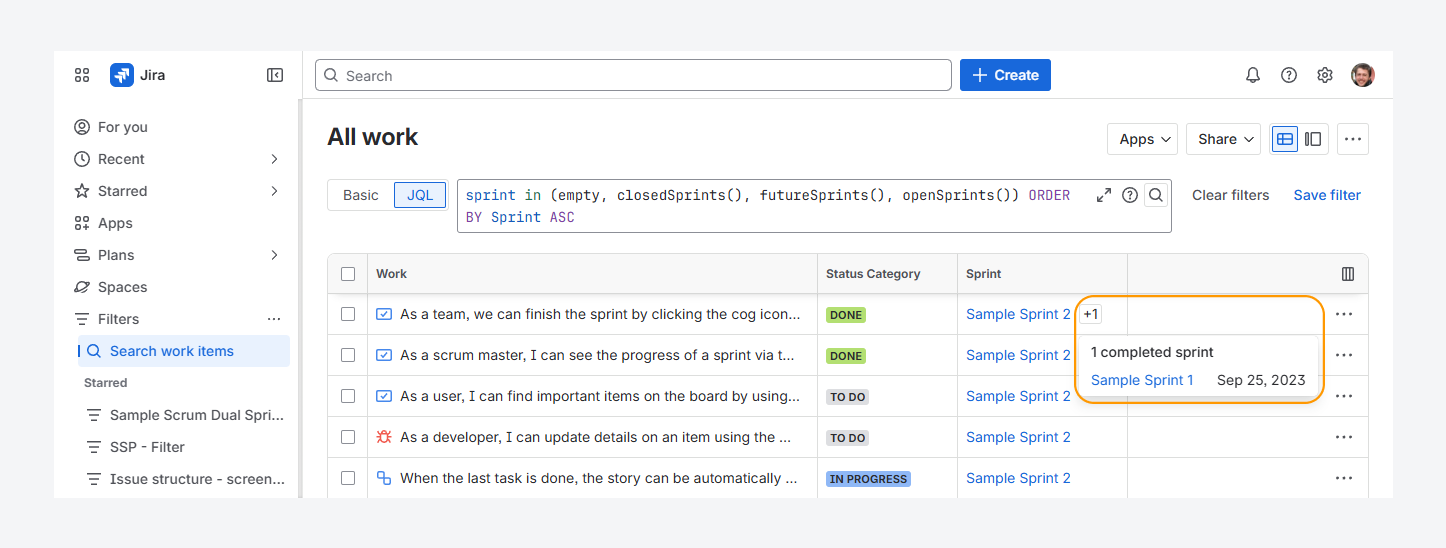
When a sprint closes and an issue is not set to Done, it is moved to the next sprint or returned to the Backlog. To track how often this happens from the board, you must enable the Sprint field in the card layout of the Active Sprints and Backlog view.
Alternatively, you can use JQL in the Issue Navigator to manually identify issues assigned to a sprint more than once, as shown in the screenshot.
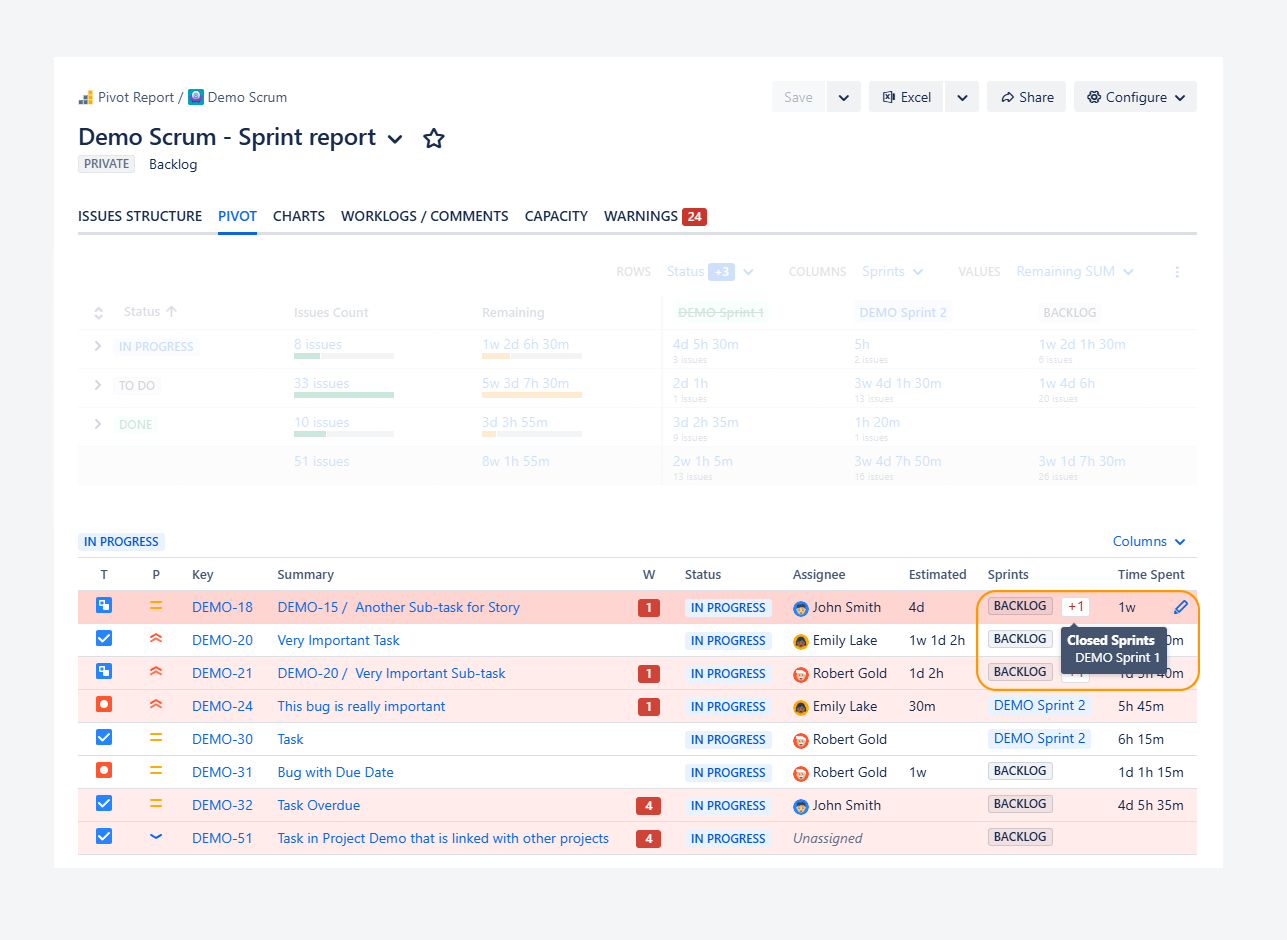
In contrast, a report provides this visibility directly. In the Breakdown section or the Issue Structure tab, the Sprints column shows how many sprints each issue has been assigned to.
As this number increases for incomplete issues, the risk of delay grows. You can then compare Time Spent against the Original Estimate to decide whether the issue should be reassigned, re-evaluated, or descoped.
Display a report in sync with a Board
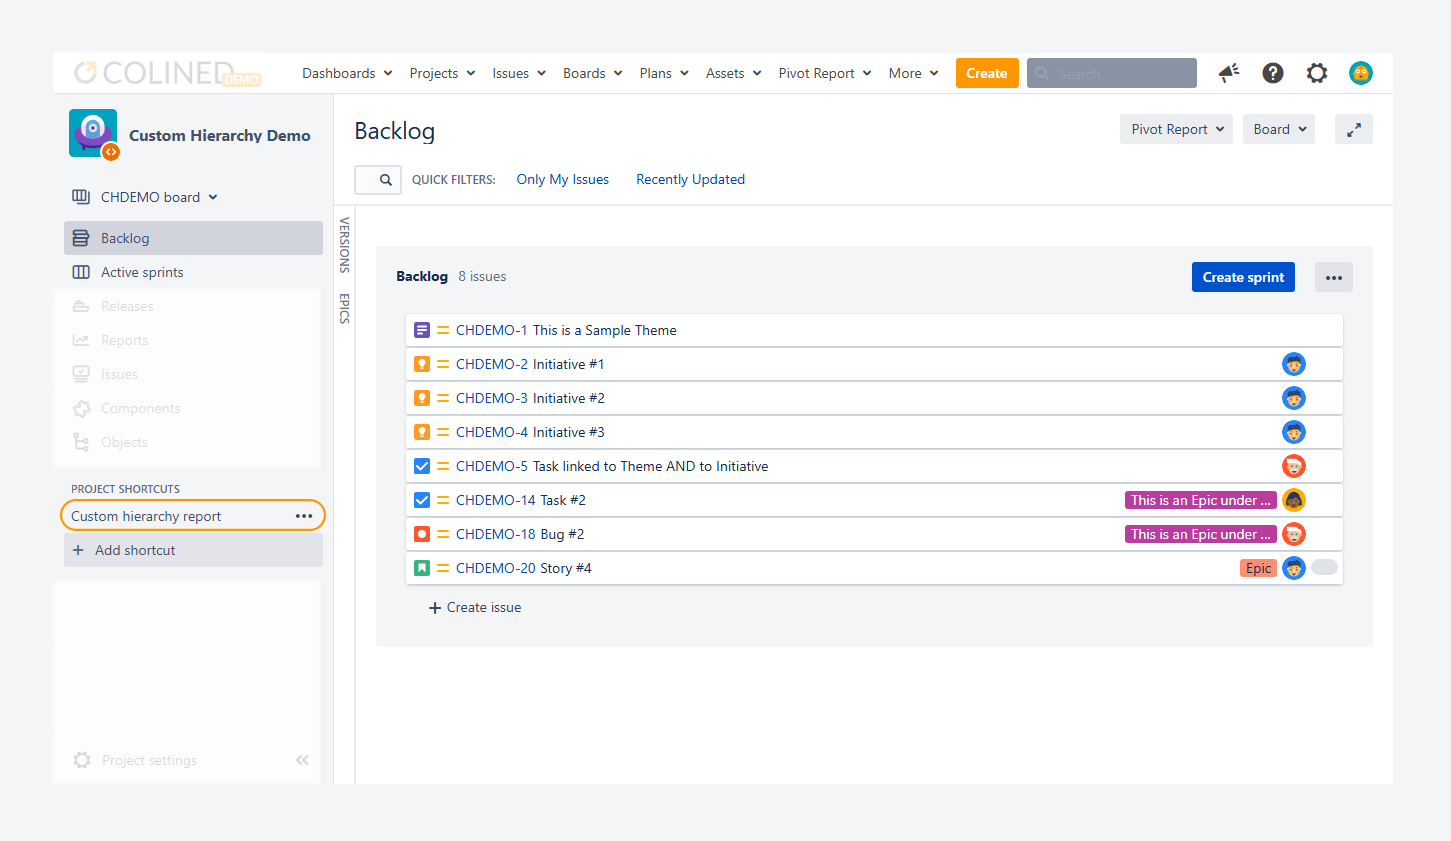
This article explains how to display a report in sync with a board using a shortcut, as shown in the screenshot above.
Why should you display a shortcut?
When a report uses the same source as a board (such as a JQL filter or projcet), it reflects changes made to that source, including status updates, sprint closures, or other board configuration changes.
By adding a shortcut, as shown in the screenshot above, you can access the report directly from the board. If you update the board while the report is open, reload the report to ensure it reflects the latest changes.
To add, remove, or edit navigation shortcuts on a board, you must have Jira admin or Project admin permissions, as described in the related article.
How can you display a shortcut?
To add a shortcut to the project sidebar:
-
Under Project shortcuts, click + Add shortcut.
-
Enter the web address (URL) and a label for the shortcut. The label can be different from the report name. Afterwards, click Add to save the shortcut.
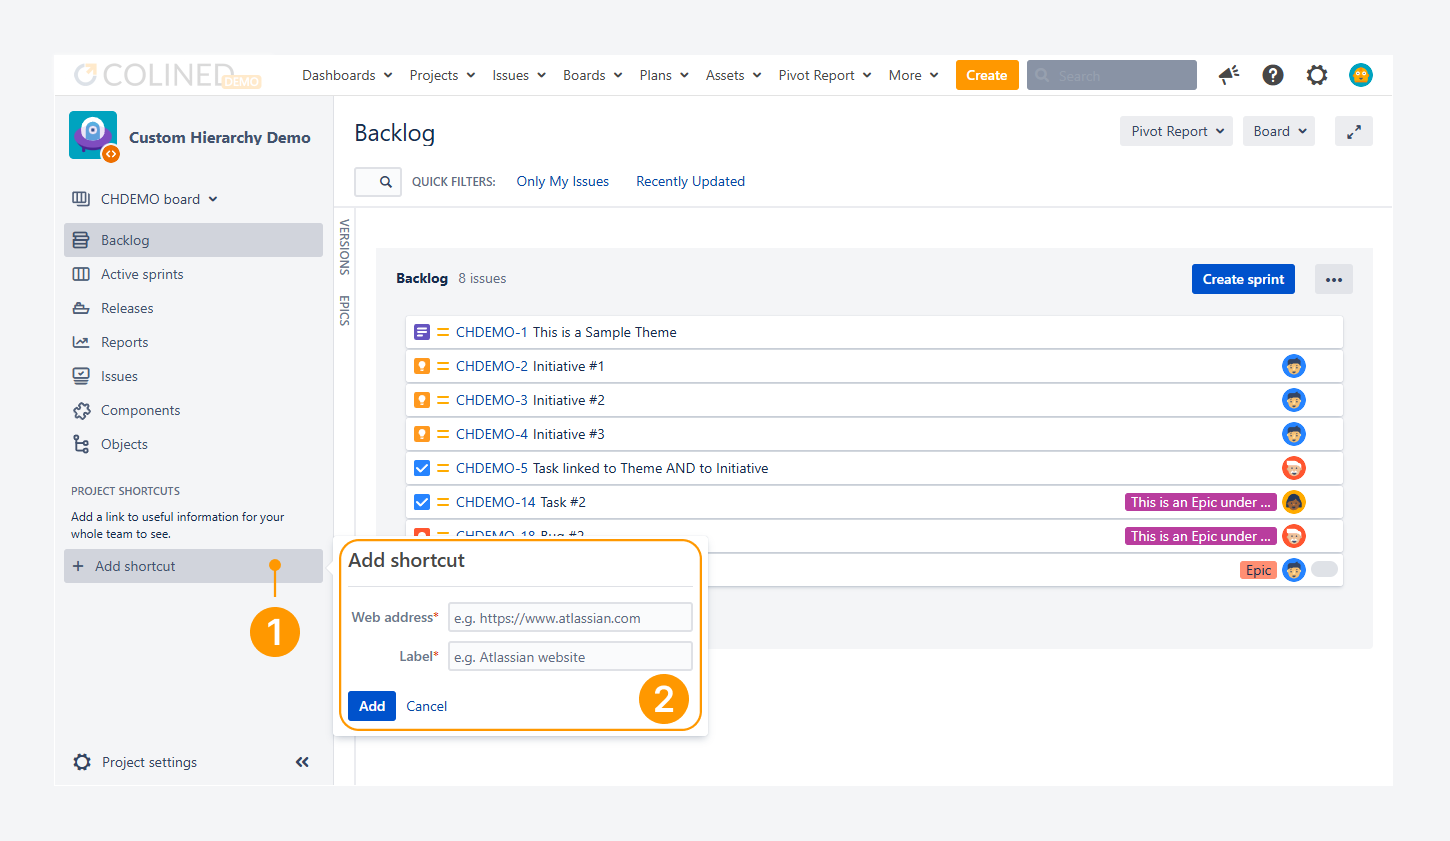
Because the report stays in sync with the board, any unmapped statuses that do not appear on the board will also be excluded from the report.
To check whether you have issues with unmapped statuses, refer to the related article.
If you have questions or need assistance, contact our support team via email or service desk. Our team is available Monday through Friday (9:00 AM to 7:00 PM GMT+7) to help with technical challenges or discuss improvements.
Display deliverables assigned to concurrent sprints
Whether you use a single sprint for the entire development team, separate sprints per project (as shown in the screenshot below), or one sprint per release, you can review their contents simultaneously in a report.
-20260305-195012.png?cb=275650baa16ce20f027d462fba84ba5b)
A report lets you analyze each concurrent sprint without being limited to the three fields available in the board Backlog card layout.
You can also display past concurrent sprints. This helps you gauge how many story points, as shown in the example, or deliverables were completed previously and compare that number with the scope planned for the active sprints.
A Jira admin can enable or disable parallel sprints by going to Administration (gear icon) > Applications > Jira Software configuration > Parallel Sprints.
How can you create a Kanban or a Scrum board report?
You can create a report for issues on a Kanban board, or generate a report for sprints on a Scrum board.
Using Kanban Board
Atlassian recommends a Kanban board for teams that:
-
Manage stories, tasks, and bugs in a continuous flow
-
Control work volume from a backlog
To create a report for a Kanban board:
-
From Jira’s top navigation bar, click Projects, and select your project.
Alternatively, use the top navigation to click on Boards and select the Kanban board.
-
In the project sidebar, select Kanban board.
-
Open the Pivot Report dropdown.
-
Select one of the three report options:
-
Active Issues: Generates a report for issues not listed in the Kanban backlog.
-
Backlog Issues: Generates a report for issues listed in the Kanban backlog.
-
All Issues: Generates a report for all issues.
-
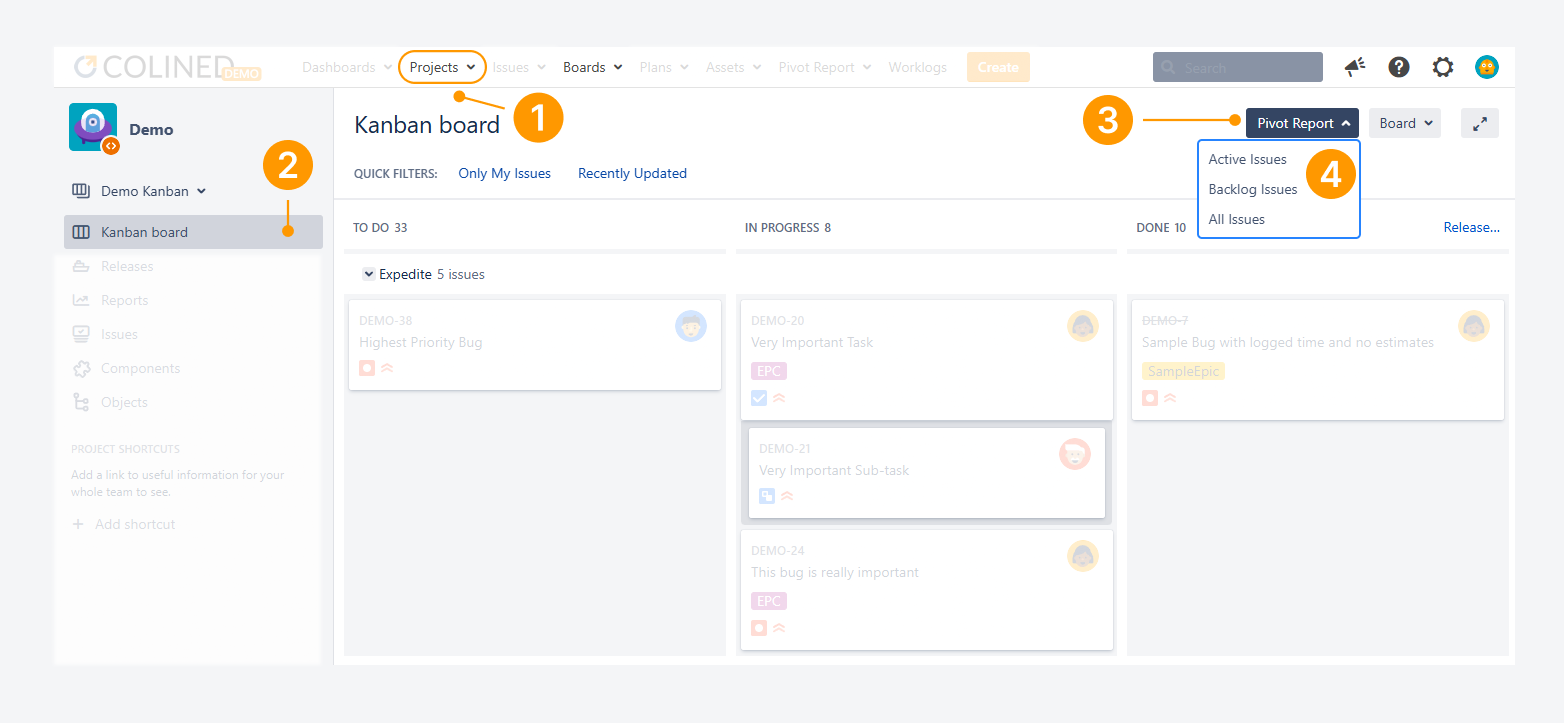
Theses steps can be repeated for a Kanban Board within a Demo environment.
Using Scrum Board
Atlassian recommends a Scrum board for teams that:
-
Manage stories, tasks, and bugs in sprints.
-
Deliver work on a regular schedule.
To create a report for a Scrum board:
-
From Jira’s top navigation bar, click Projects, and select your project.
Alternatively, use the top navigation to click on Boards and select the Scrum board.
-
In the project sidebar, select Active sprints or Backlog.
-
Open the Pivot Report dropdown.
-
Select one of the 4 report options.
-
Active Sprint Issues: Generates a report for all issues in the active sprint (if one exists on the board).
-
Future Sprint Issues: Generates a report for all issues in upcoming sprints (if they exist on the board).
-
Backlog Issues: Generates a report for all active issues not assigned to an active or future sprint.
-
Custom: Opens a ‘Pivot Report Options’ pop-up, where you can access additional settings.
-20260305-195313.png?cb=f0448db3bc74e7162660bf47863467a5)
Custom report options
If you select Custom from the list of report options in Step 5, the Pivot Report Options pop-up appears.
-
Select the sprints from the board that you want to include in the report. By default, all two options are selected when the pop-up opens. You can clear any option to refine the report.
The available options are:
-
Active: Issues from active sprints (one or more)
-
Future: Issues from all future sprints after the active sprint
-
Backlog: All active issues not assigned to an active or future sprint
-
Last 2 Closed Sprints: Issues from the two most recently closed sprints
-
If needed, select the option to include parent issues to expand the report scope. Parent issues are described by Atlassian in a separate article.
-
Click Submit to apply your selections.
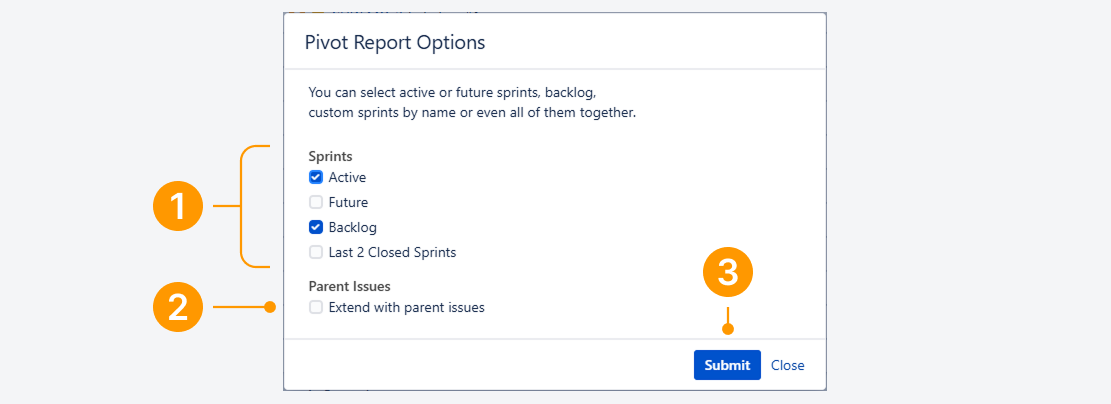
Theses steps can be repeated for a Scrum Board within a Demo environment.
FAQ
What is the report's name and description when using this method?
-20250930-024439.png?cb=356089ad5b51969c0a5a5e1e74afff19)
By default, when you create a report using the actions menu in the Board:
-
Report name – Matches the board’s name where the actions menu is used. Until saved, the name remains a hyperlink to the board.
-
Description – Shows which sprint work items are included.
-
For Active Sprint, Future Sprint, or Backlog issues, the description reflects the option selected. For example, the screenshot above shows a report created from the SSP board for Active Sprint issues.
-
For Custom issues, the description displays “Board Report” when the report is created using options from the Pivot Report Options pop-up.
-
To rename the report, update its description, adjust its scope (e.g. remove Parent or Sibling issues), or add more tabs, first save the report, then use the Sidebar to make changes.
Troubleshooting
Can issues be hidden in a Board and report?
-20260305-195446.png?cb=48f1e066a960bd85b058baac47dbcefc)
The screenshot above shows a report built from a board to display Backlog issues. No issues appear because items with a To Do status are not mapped to any column on the board.
As a result, these issues do not appear on the board and are not included in the report.
Issues can be hidden in a board or report if they have unmapped statuses.
-
To display them, map these statuses to a board column by following the steps in the related article.
-
Afterwards, ensure you have the necessary permissions to access the issues included in the report source, as explained in a separate article. Without these permissions, some issues may remain hidden from you but still appear to other users.
If you have questions or need assistance, contact our support team via email or service desk. Our team is available Monday through Friday (9:00 AM to 7:00 PM GMT+7) to help with technical challenges or discuss improvements.