
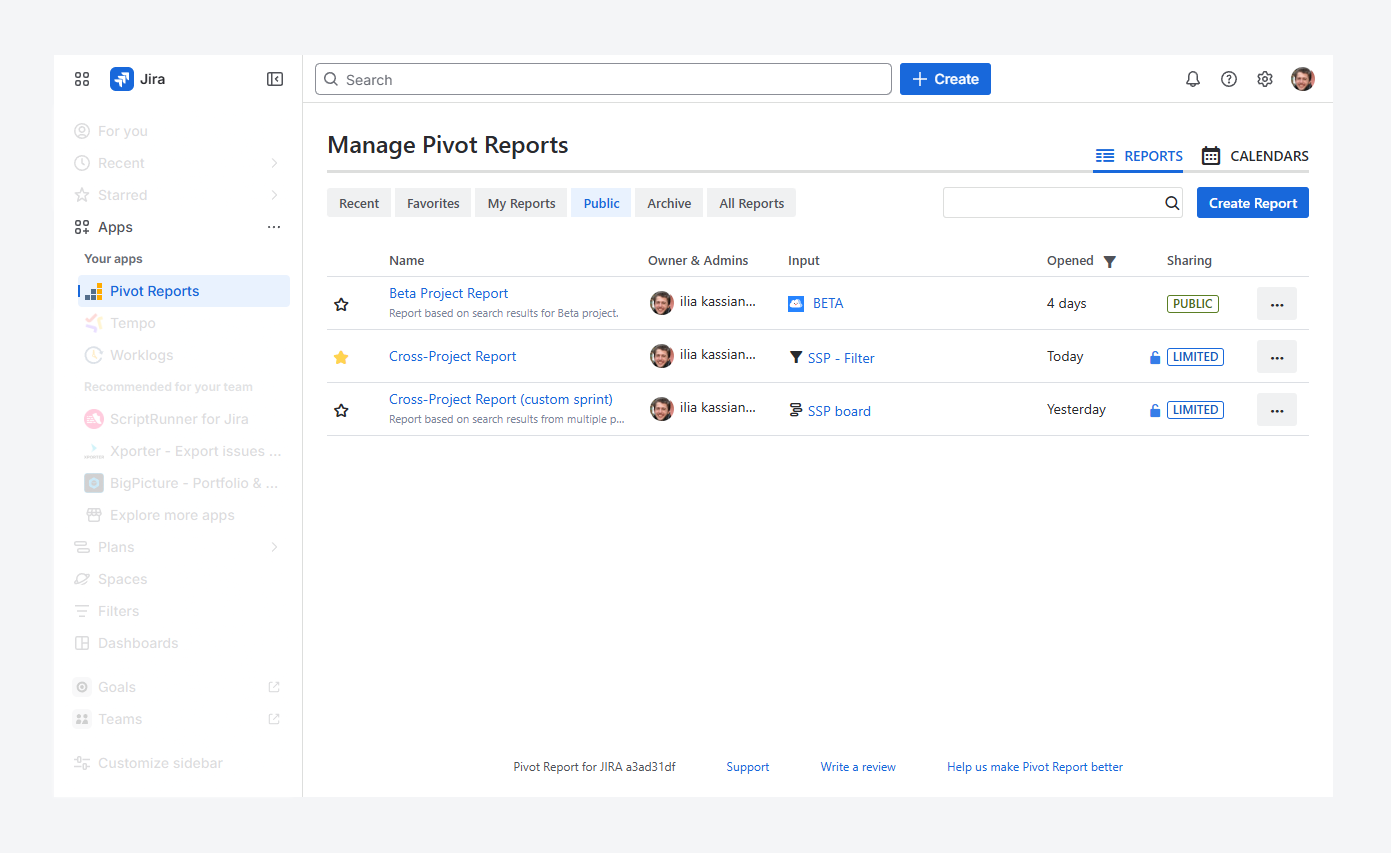
This article explains how to create a report using a button on the Manage Pivot Reports page, where you can also view all reports accessible to your account.
Why should you use this page?
You can use the Manage Pivot Reports page to create reports. This method is useful when you want full control over the report’s source during creation, while still using the creation options available in the Issue Navigator or an Agile Board.
You can also use this page to locate reports you have permission to view and identify reports that overlap in source or name.
Features and use cases
Reference multiple projects when creating a report.
-20260317-004430.png?cb=2b702bf0d10f968c8b4f92f893682b69)
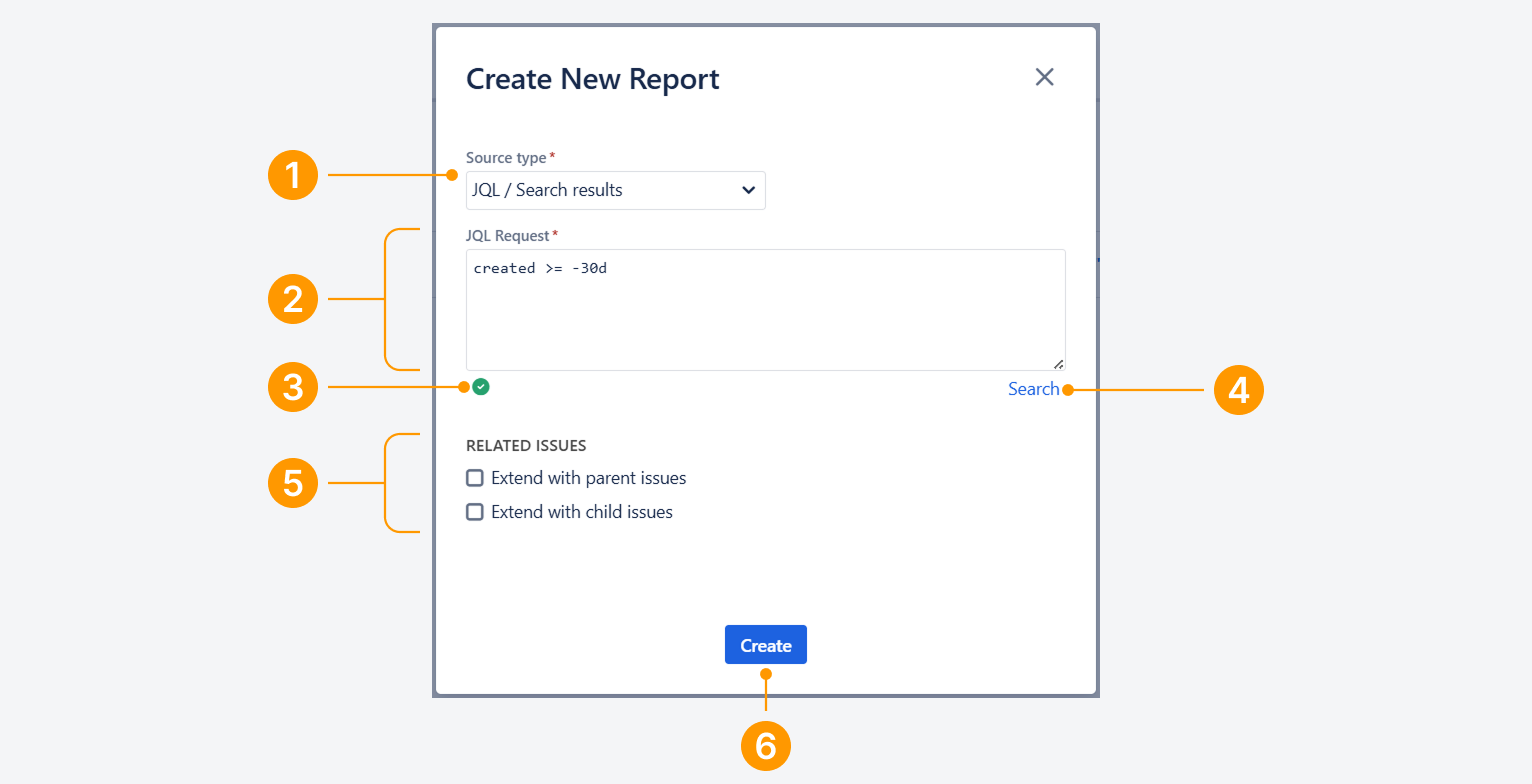
When you click Create Report on this page, the Create New Report pop-up appears.
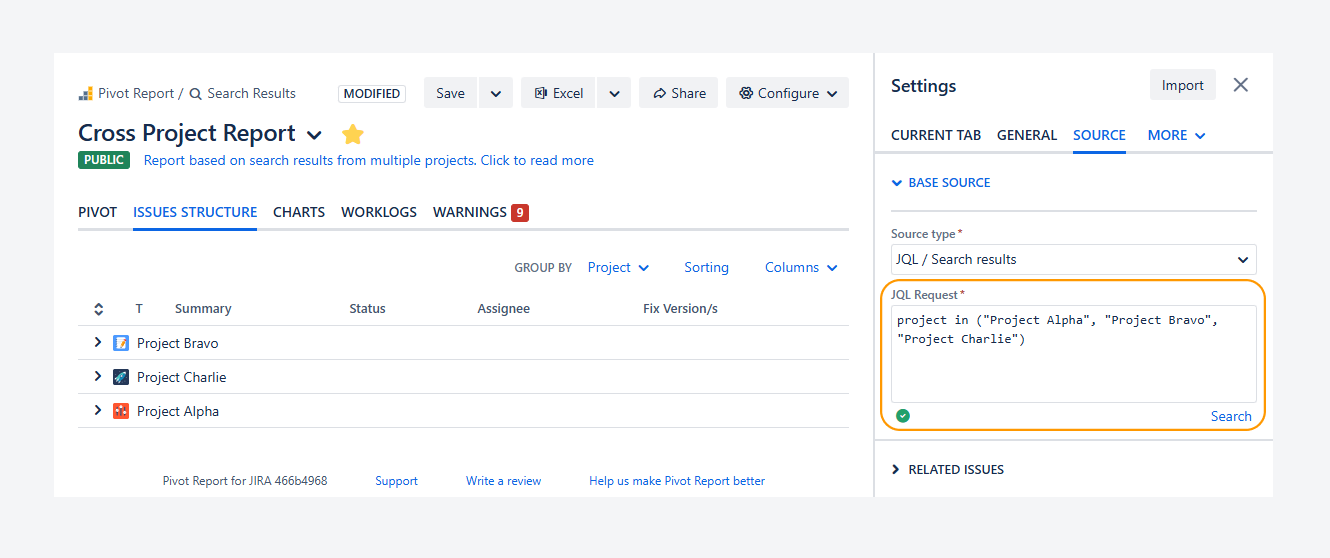
You can use this pop-up to include multiple projects by entering JQL, as shown in the screenshot above, or by selecting a filter.
For example, the Cross Project demo report shown in the screenshot below is based on a JQL query that references three projects. The report sidebar also shows the same projects that appear in the pop-up above.
You can achieve similar results by using a Board or the Issue Navigator as the source if it references multiple projects through JQL or a filter.
In comparison, using the Manage Pivot Reports page helps you check whether another report already exists with the same source or name that you can access. If a report uses a similar source, you can copy it from this page. The copied report is already configured and may highlight insights from a previous analysis based on the same source.
-20260317-012150.png?cb=ea5a470d225f80d14543bdaa9bcf15e0)
The steps to find existing reports are described in the related article.
How can you access this page to create a report?
The Manage Pivot Reports page can be accessed from Jira’s top navigation bar. On this page, use the button to create a report.
-
Click on Pivot Reports in the top navigation bar.
-
Select Manage Reports.
-
On the right-hand side, click Create Report.
-20260303-025743.png?cb=4cf0a17b6554a0359543704cba84ebb5)
-
In the Create New Report pop-up, select a Source type.
-
Optionally, check the boxes to include parent and child issues in the report.
-
Click Create.
-20260303-030103.png?cb=c80a902ca23cdcab910a8acdf2858831)
What source types can you use to create a report?
In the Create New Report pop-up, shown in the previous section, you can select one of six available source types to create a report from the Manage Pivot Reports page:
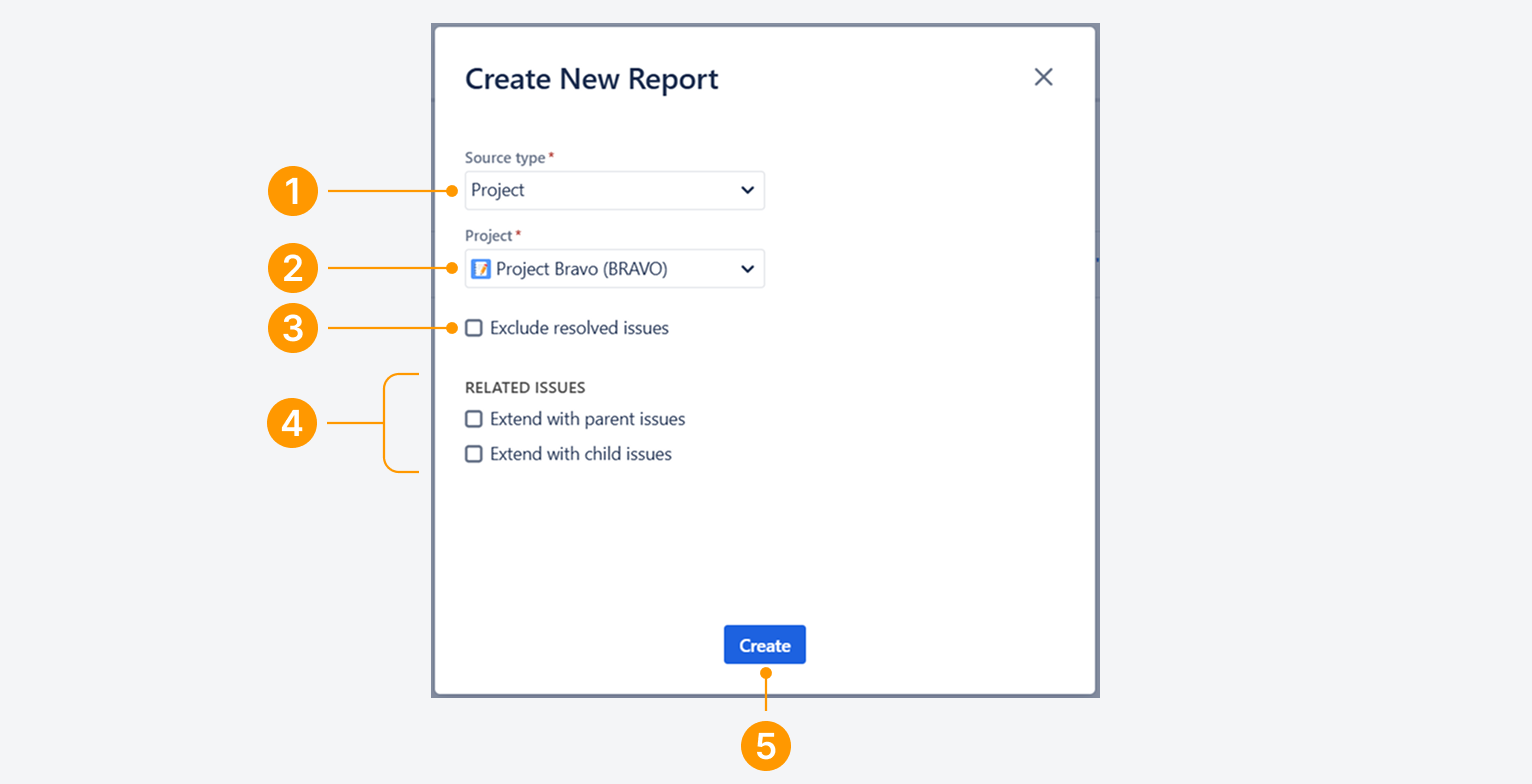
Project
-
Set the Source type to Project.
-
Select the project to be referenced in the report.
-
Optionally, check Exclude resolved issues to exclude issues with the status category ‘Done’ in the report.
-
If needed, check the boxes to include parent and child issues to extend the report, which are defined by Atlassian in a related article.
-
Click Create.
Board
Kanban Board
-
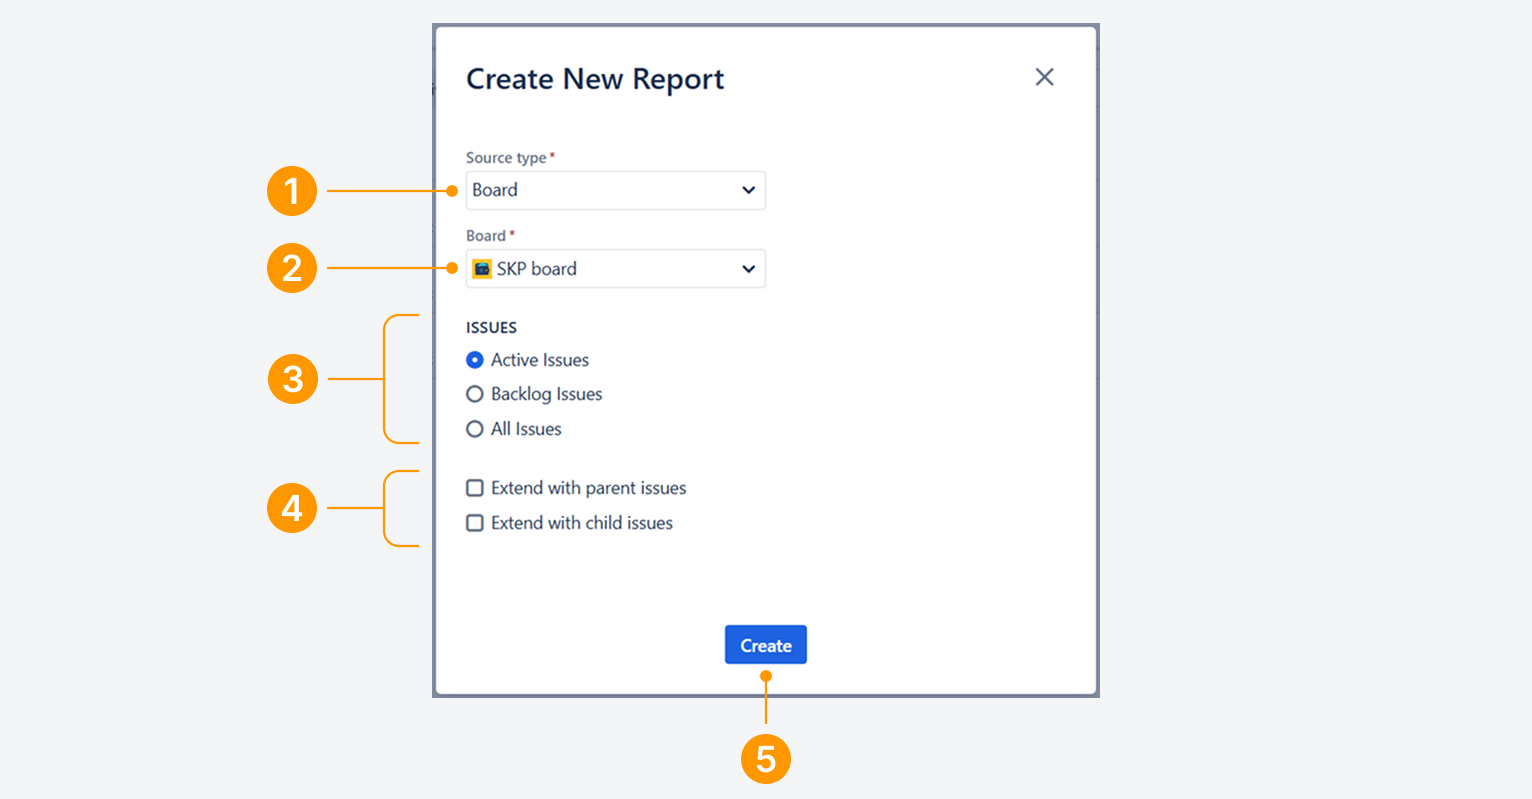
Set the Source type to Board.
-
Select the board to be referenced in the report.
-
Optionally, select work items from the Board to filter issues for the report. The report will include:
-
Work items not listed in the Kanban backlog.
-
Work items listed in the Kanban backlog.
-
All work items.
-
-
If needed, check the boxed to include parent and child issues to extend the report, which are defined by Atlassian in a related article.
-
Click Create.
Work items in the Unmapped statuses column will not appear in the report, as mentioned in a related article.
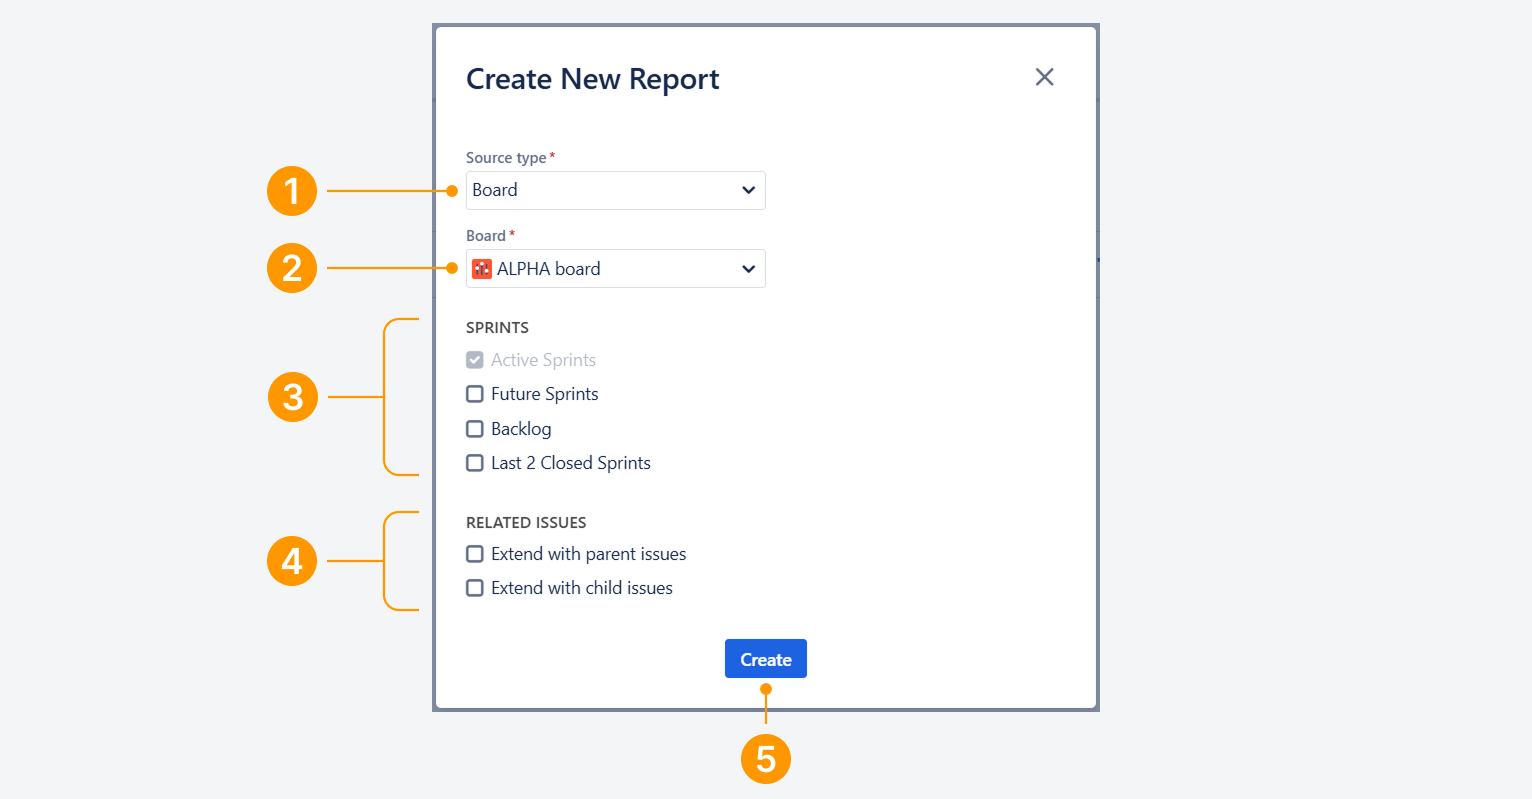
Scrum Board
-
Set the Source type to Board.
-
Select the board to be referenced in the report.
-
Optionally, select all applicable sprints from the Board to filter issues for the report. The report will include:
-
Work items from active sprints (one or multiple).
-
Work items from all future sprints following the active sprint.
-
All active work items not assigned to an active or future sprint.
-
Work items from the two most recently closed sprints.
By default, Active Sprints is selected and greyed out. It can be unchecked once another option is chosen.
-
-
If needed, check the boxed to include parent and child issues to extend the report, which are defined by Atlassian in a related article.
-
Click Create.
Work items in the Unmapped statuses column will not appear in the report, as mentioned in a related article.
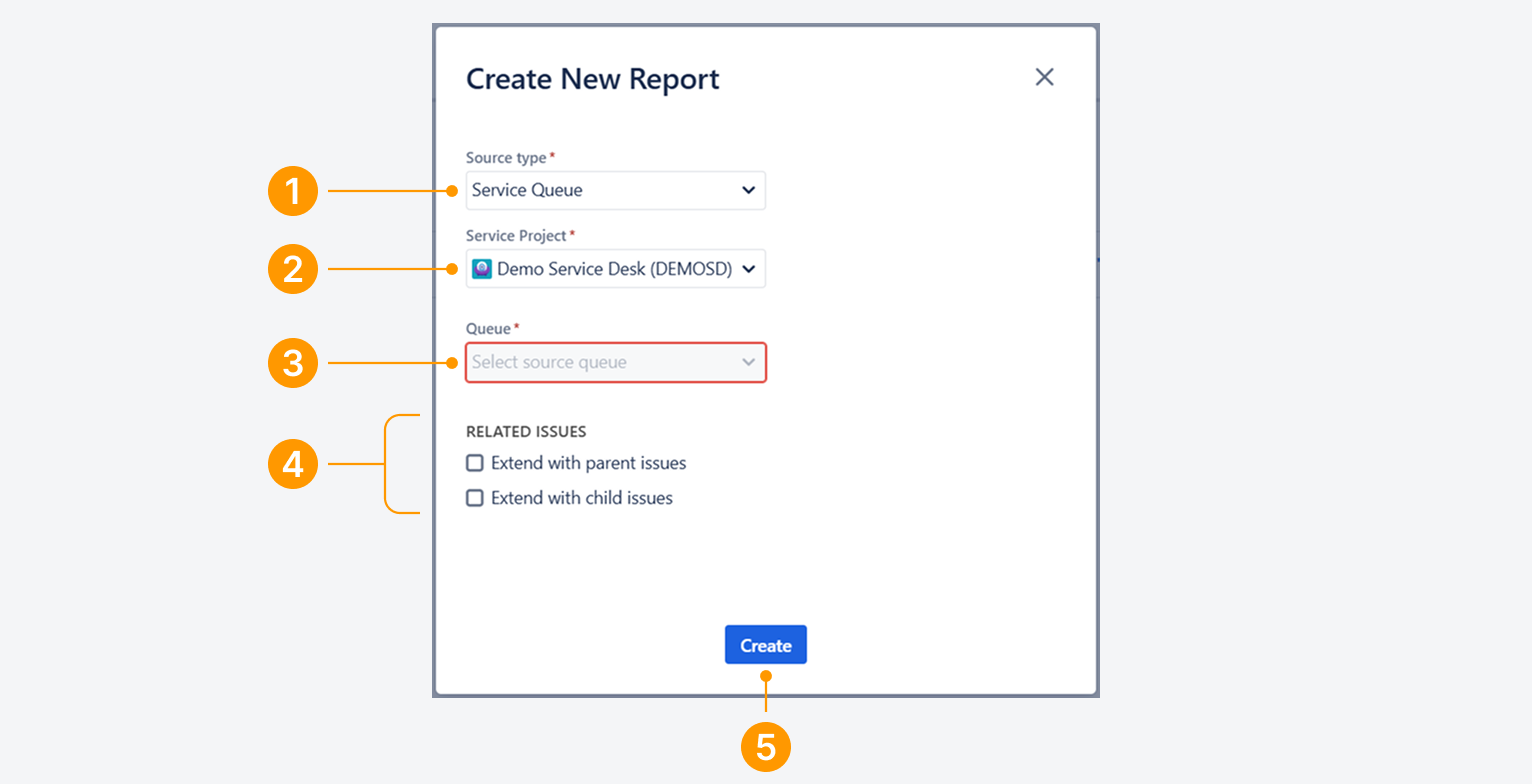
Service Queue
-
Set the Source type to Service Queue.
-
Select the Jira Service Management project to be referenced in the report.
-
Select a Queue. The default three queues for a Service Project are All My Tickets, All Open Tickets, and Open Tasks.
-
If needed, check the boxed to include parent and child issues to extend the report, which are defined by Atlassian in a related article.
-
Click Create.
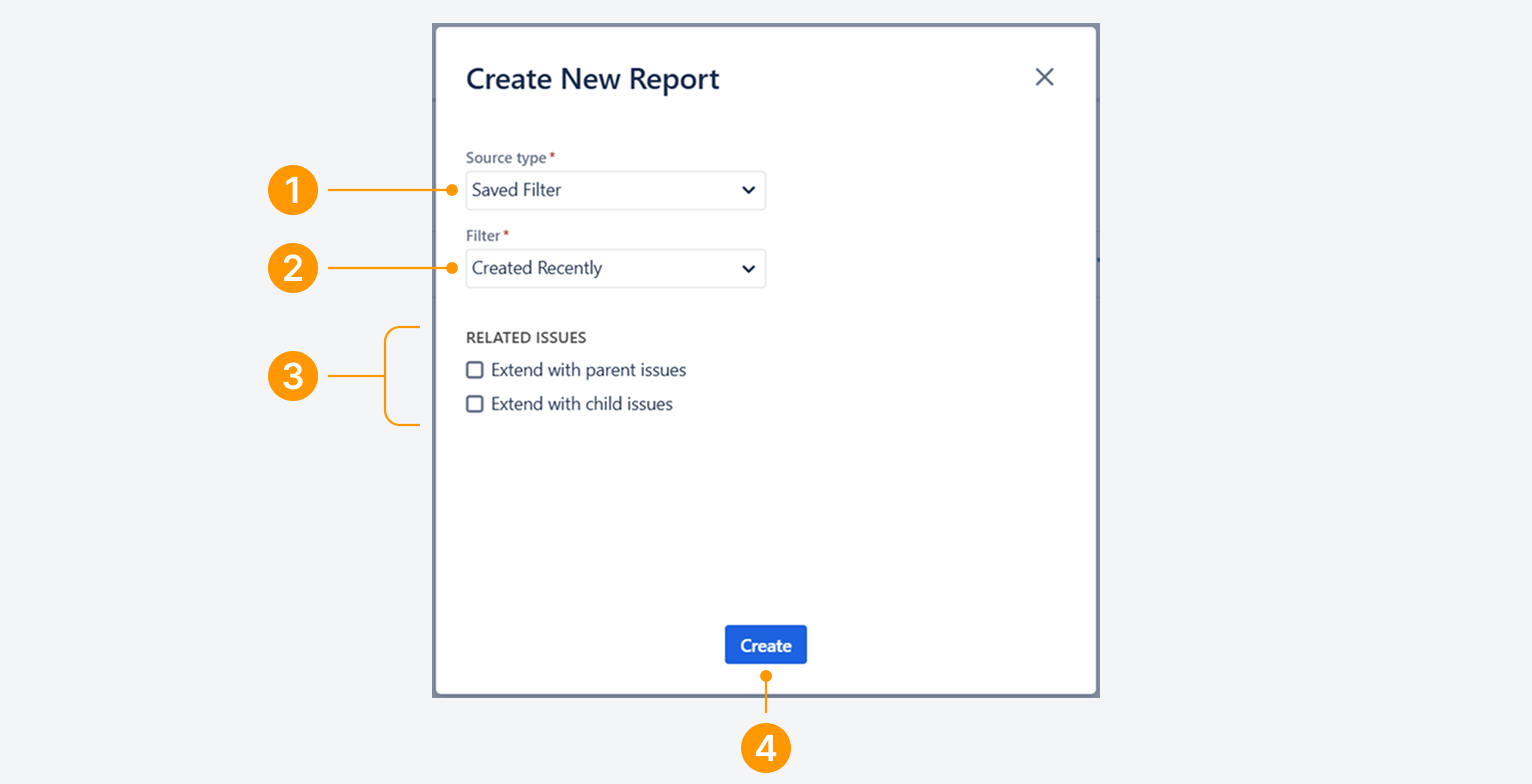
Saved Filter or Issue
Saved Filter
-
Set the Source type to Saved Filter.
-
Select the filter to be referenced in the report.
-
If needed, check the boxed to include parent and child issues to extend the report, which are defined by Atlassian in a related article.
-
Click Create.
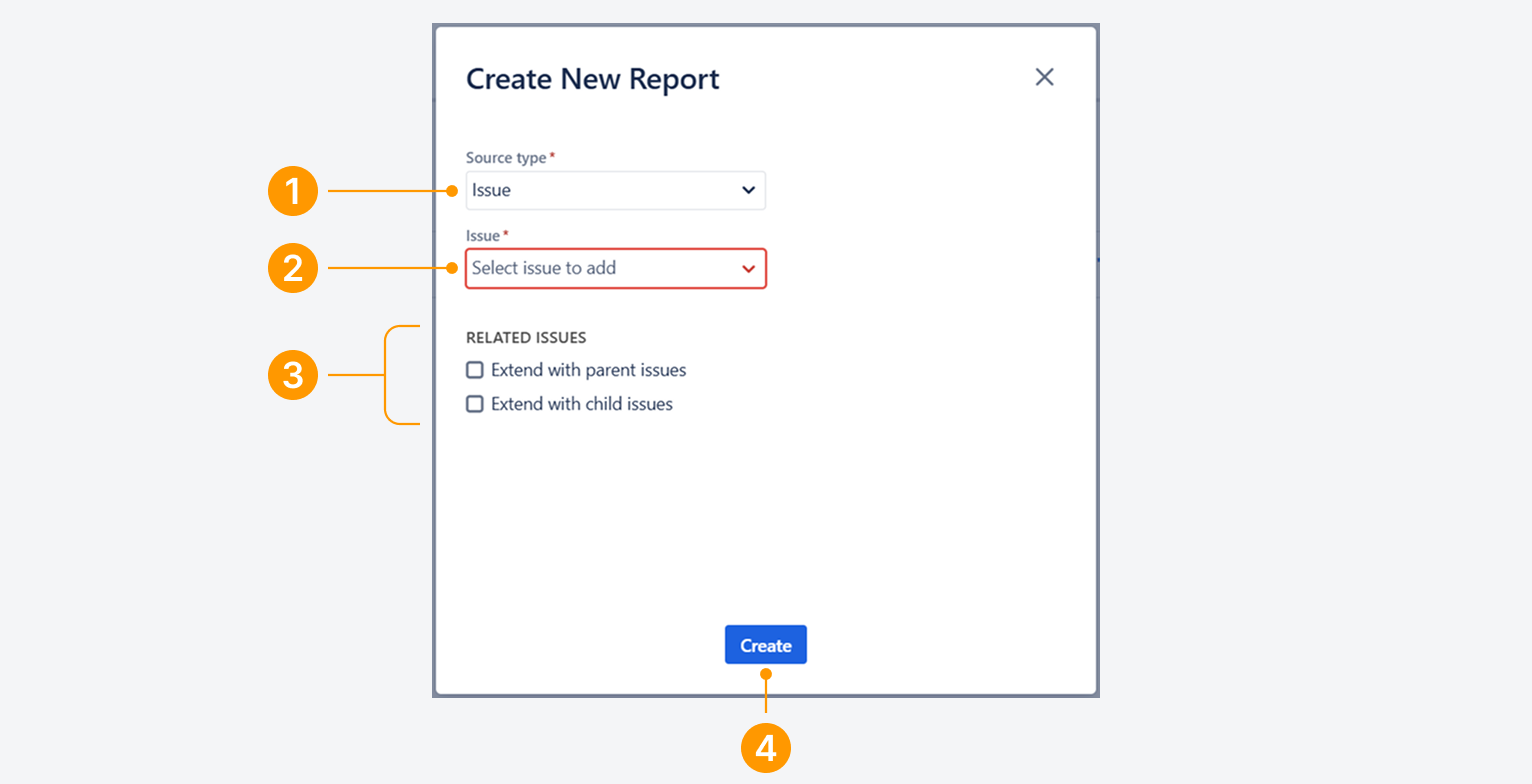
Issue
-
Set the Source type to Issue.
-
Select the issue to be referenced in the report.
-
If needed, check the boxes to include parent and child issues to extend the report, which are defined by Atlassian in a related article.
-
Click Create.
JQL / Search results
-
Set the Source type to JQL / Search results.
-
Enter the JQL query to be used in the report.
-
If the query is valid, a green checkmark will appear (see screenshot).
-
To troubleshoot the query in the Issue Navigator, click the Search link and follow the steps in a related article.
You cannot create the report until the query is considered valid.
-
If needed, check the boxed to include parent and child issues to extend the report, which are defined by Atlassian in a related article.
-
Click Create.
Will you need to save the created report?
When you create a new report from the Manage Pivot Reports page, a saved report is created alongside its unique ID. In contrast to the other methods, the created report only needs to be saved after you apply additional changes to it.
FAQ
Troubleshooting
How can you locate the 'Create Report' button if it is missing?
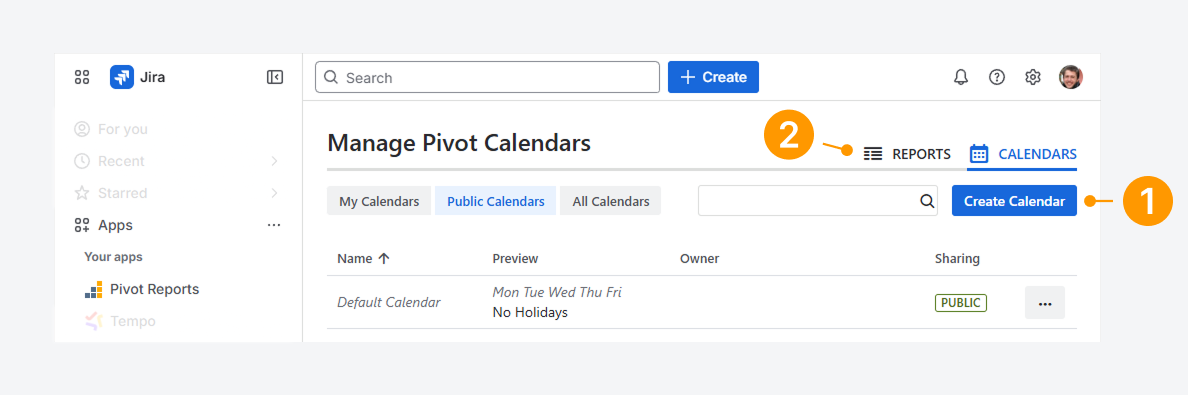
If the ‘Create Report’ button is missing from your tab:
-
Check whether the ‘Create Calendar’ button appears instead, as shown in the screenshot. If it does, you are currently in the Calendars tab.
-
Click on the Reports tab to access the ‘Create Report’ button.
How can you resolve the unbound queries error?
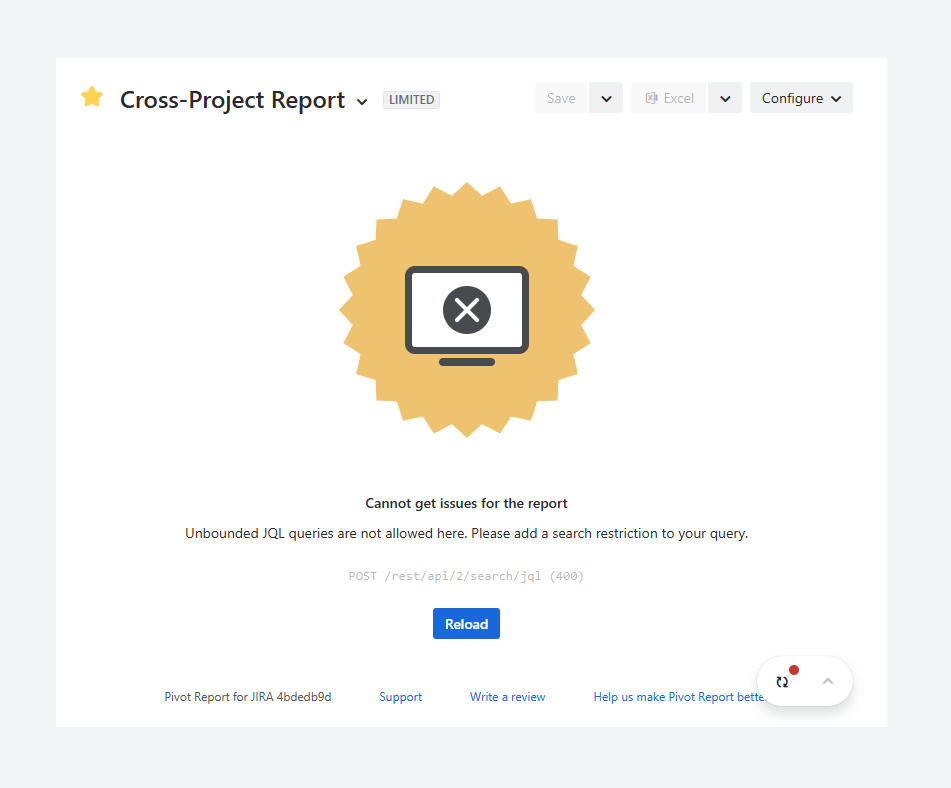
The error above appears when the report source is unbound, whether it uses a saved filter or a JQL query. Follow the steps in the related article to resolve it.
If you have questions or need assistance, contact our support team via email or service desk. Our team is available Monday through Friday (9:00 AM to 7:00 PM GMT+7) to help with technical challenges or discuss improvements.